All blog posts
<- View categories
-
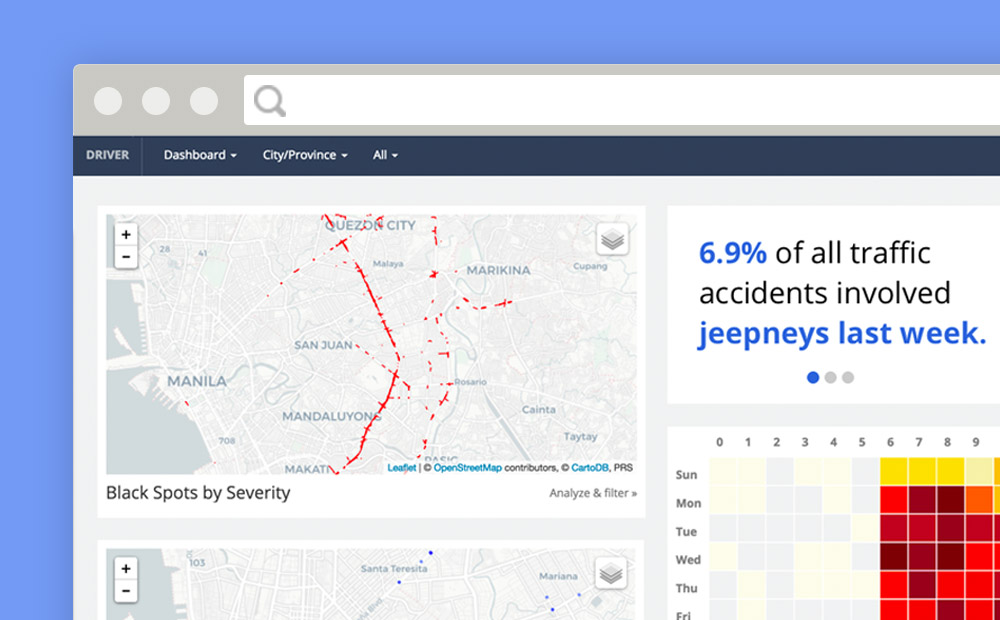
Reducing Road Crashes with DRIVER
Over 1.3 million people are killed on the world’s roads every year. More than 30 million suffer life-changing injuries. Based on current trauma levels an estimated 400 million people will be killed or injured between now and 2030. Source: IDB Road crashes are a leading cause of death globally, but these deaths occur mostly in…
-
A Year of QA at E84
A little over a year ago, I was looking to leave my previous position at a large consulting agency. At the time, I was working as a business analyst and was wearing a few too many hats. I was looking to transition away from the waterfall-heavy role and more into a design-based role, such as…
-
How We Select Projects
As a mission-based organization, how we select the projects we pursue is an ongoing conversation at Azavea. We share our thought process here.
-
High Stakes, Hard Certs
Deciding to take the AWS Certified Solutions Architect: Professional exam at re:Invent. This certification is considered one of the toughest to achieve in IT, and it lived up to the hype. It was brutal. So brutal in fact, that after seeing that I passed, I questioned why I took it, whether it was worth it,…
-
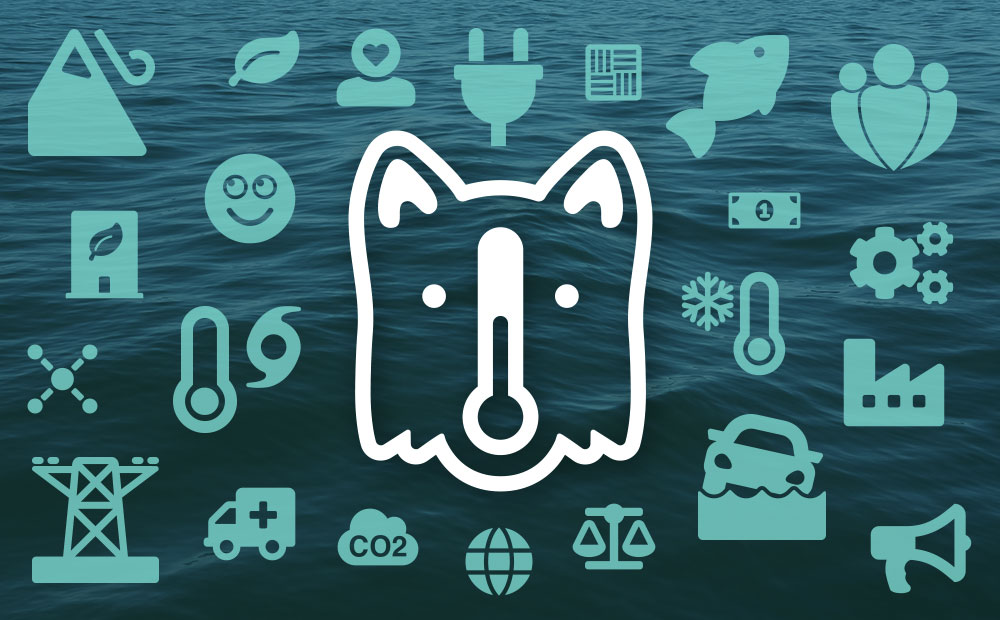
Giving Form to Temperate’s Identity
Part two of our design process series details how we established Temperate’s brand in a saturated industry, with the product’s goal driving decision making.
-
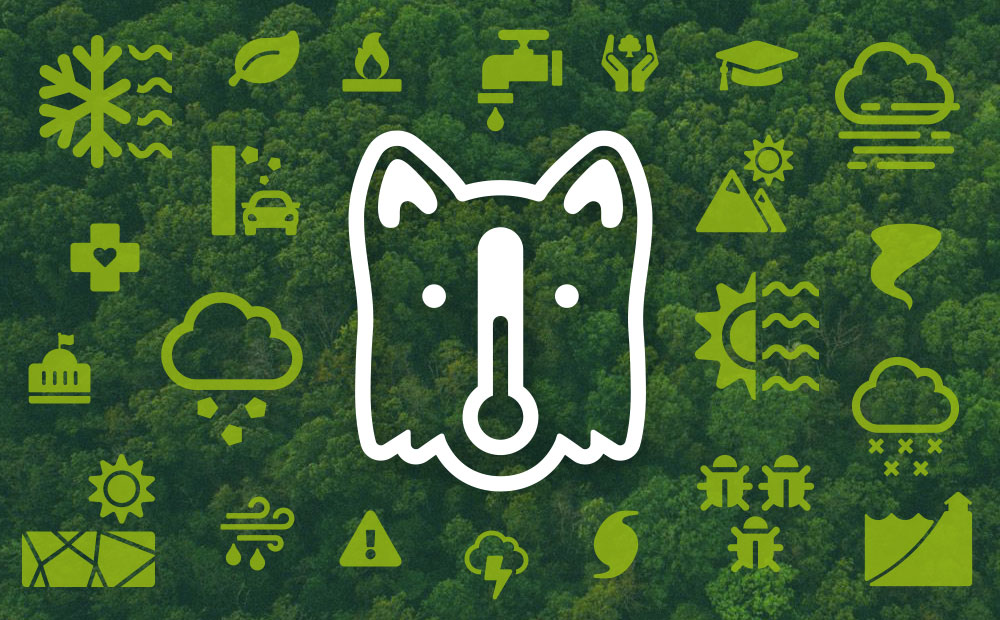
Problem-solving by asking questions
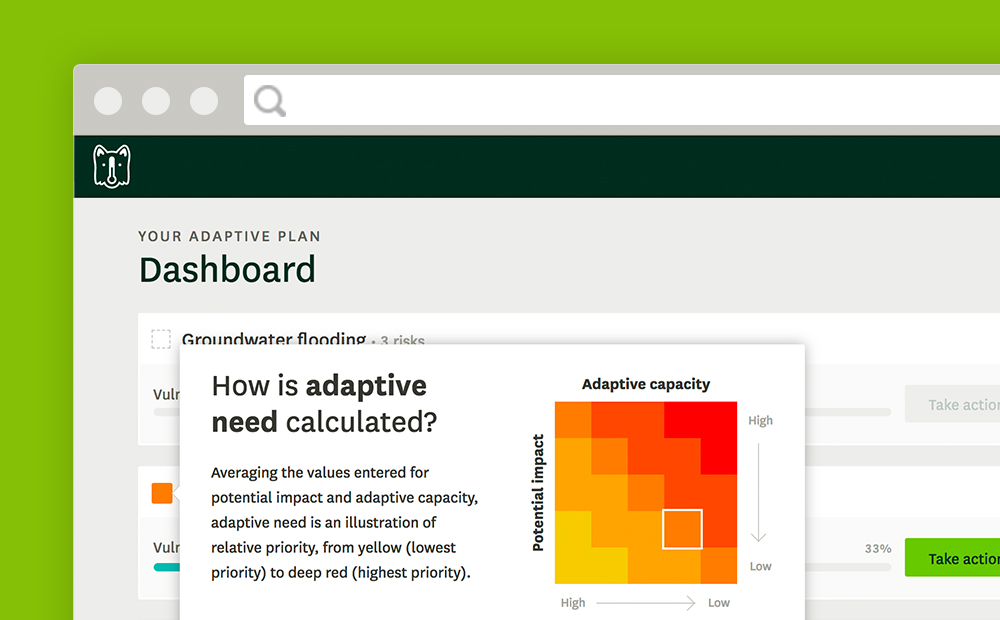
The first in a two-part series, this blog post details how we solved a design problem by asking questions in building our climate adaptation planning app.
-
AWS Enables Temperate
We recently released Temperate: A new climate adaptation planning companion for cities. This blog explores how AWS, and the data they host, fueled this app.
-
E84 Lab Notes: Machine Learning with SageMaker
In a previous post we showed how the E84 R&D team used RoboSat by Mapbox to prepare training data, train a machine learning model, and run predictions on new satellite imagery. In this example, we’re going to use the same imagery source and label data as a proxy for data produced by our AWS disaster…
-
Six Ways we Fund Innovation
Without outside funding and given our commitment to openly sharing our knowledge, people often ask: How do you fund your innovation? We outline 6 main ways.

-
Temperate: Your Climate Adaptation Planning Companion
Azavea rolled out Temperate, a climate adaptation planning app, in 2018. Get the details here.