Climate
<- Return to all blogs
-

Enhancing accessibility in a wildfire risk web application
Wildfires in the U.S. are becoming larger and more destructive driven by climate change, a century of forest mismanagement, and increasingly more construction in fire-prone areas. Since 2019, our team has contributed to Wildfire Risk to Communities, a free resource by the USDA Forest Service and Pyrologix in partnership with Headwaters Economics. Element 84 designed…
-
Sustainable AI: Reduce Your Carbon Footprint, Cut Costs, and Keep Your Users Happy
Our team at Element 84 is excited about AI’s potential to help in building systems, understanding the impacts of climate change, and generally helping users access data. At the same time, we’re also concerned with the environmental impact of using this technology. Hugging Face sums up the issue well in their AI Environment Primer: Artificial…
-
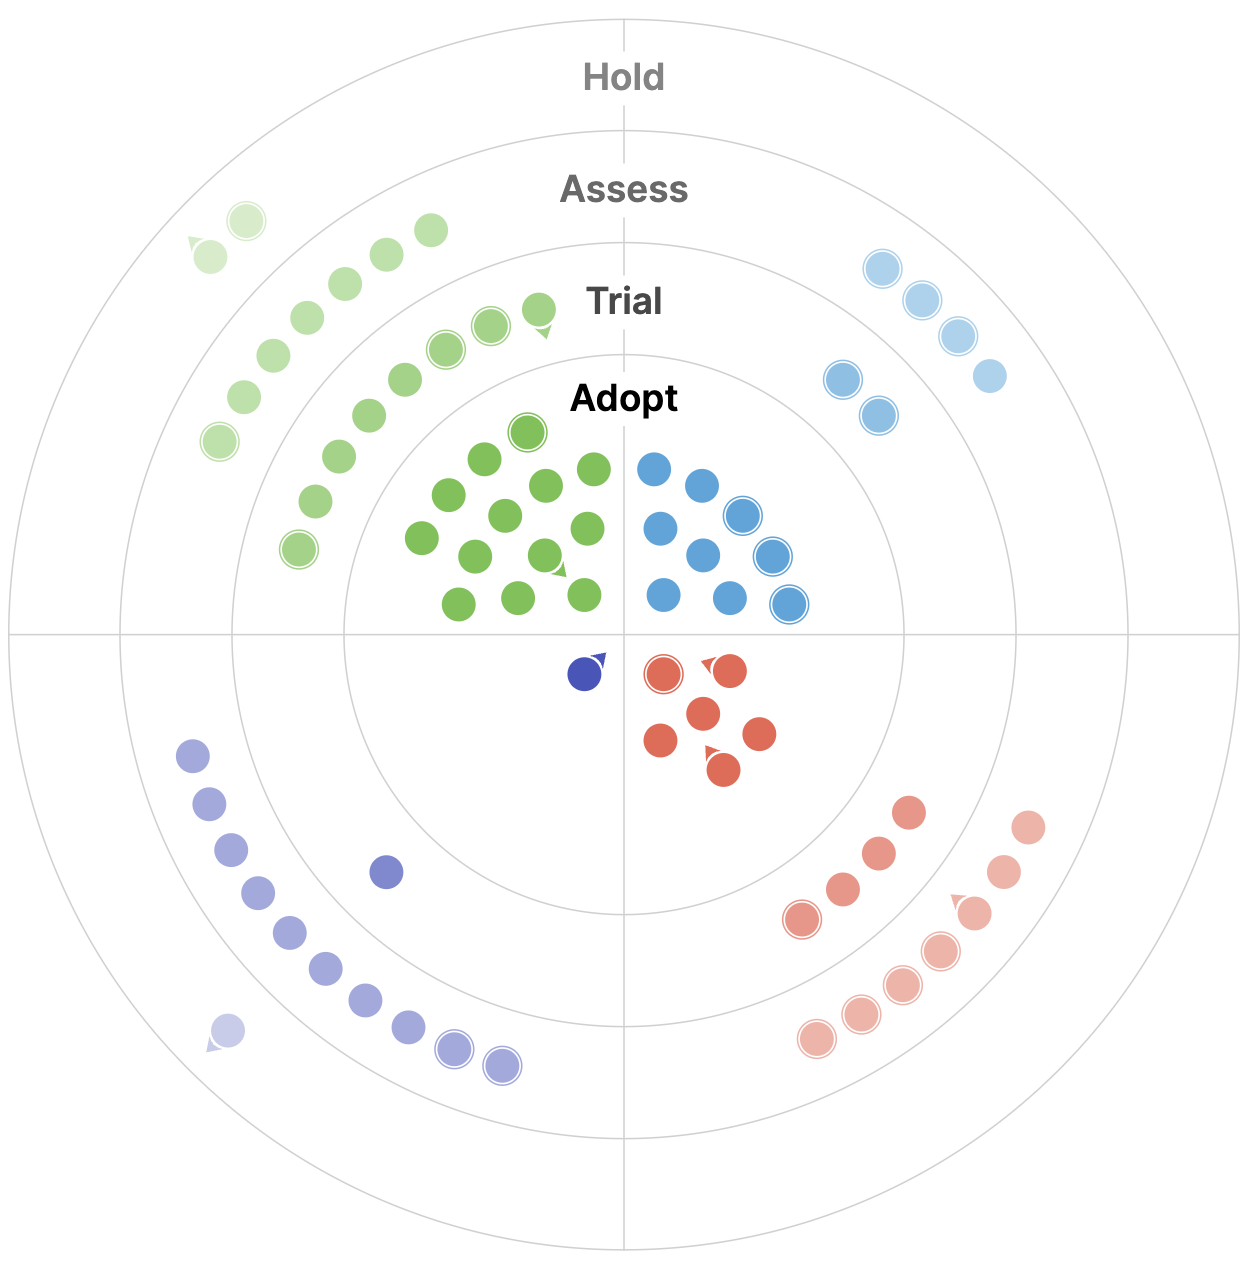
Updating our Geospatial Technology Radar for 2024
We introduce the second iteration of our geospatial technology radar, which is designed as a resource for the community to outline impactful technologies in the space.
-
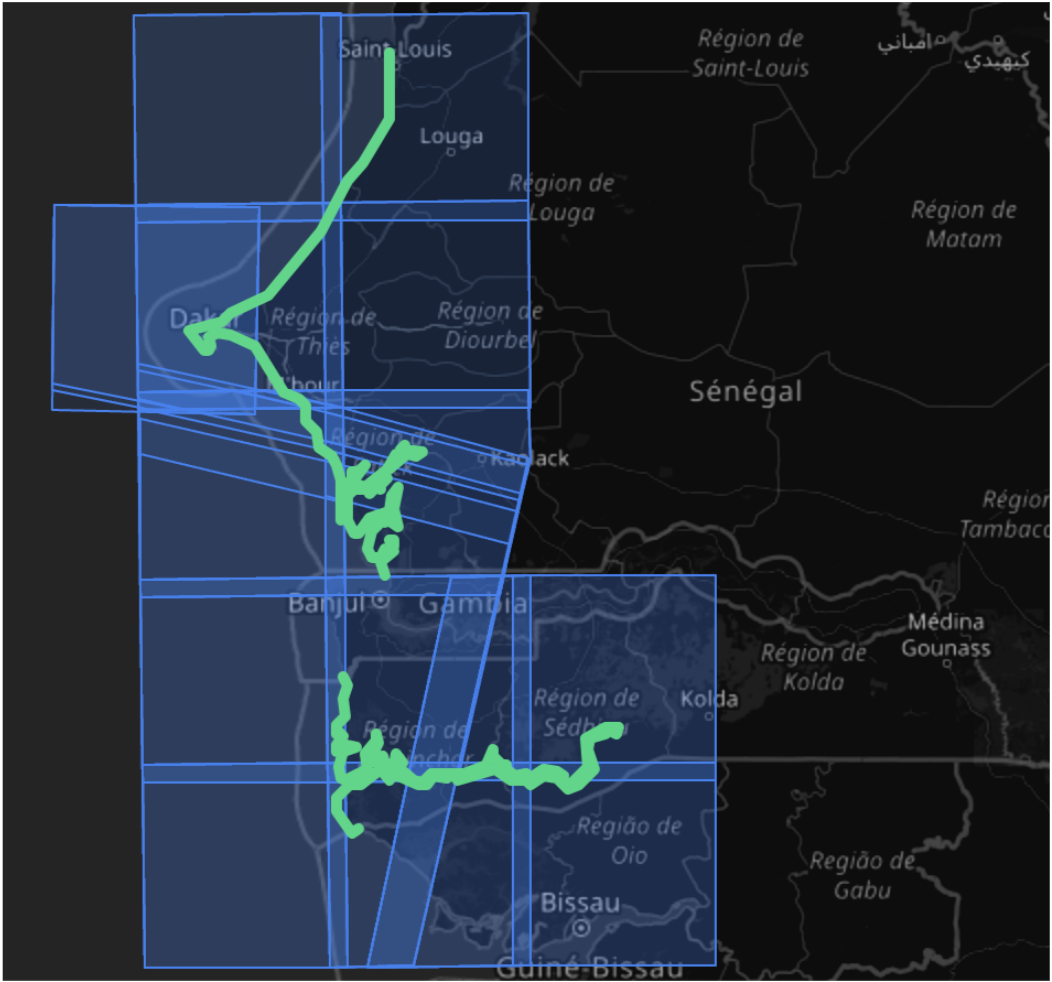
Segmenting Sandstorms in Satellite Imagery
In this blog, we walk through our approach to segmenting sandstorms in satellite imagery, evaluate the quality of our results, and compare them against existing solutions.

-
Natural Language Geocoding
We discuss how natural language geocoding is changing the landscape of data analysis, making it more accessible and efficient.

-
Climate Unit Director Profile: Catherine Oldershaw
In this blog series, we’re profiling the new directors of our business units to provide a full picture of how we’re gearing up to make the biggest possible impact in 2024 beginning with this feature of Catherine Oldershaw, our Climate Unit Director.

-
Using Kerchunk to make NOAA’s National Water Model Dataset more accessible
In this blog, we discuss our experience using Kerchunk to improve access times to short-range streamflow predictions generated by NOAA’s National Water Model Predictions Dataset, achieving a speedup of 4 times, using 16 times less memory.

-
14 Years of Helping to Manage Stormwater in Philadelphia
A recap of Azavea’s partnership with the Philadelphia Water Department to support stormwater management through Philadelphia’s Green City, Clean Waters plan.
-
Benchmarking Zarr and Parquet Data Retrieval using the National Water Model (NWM) in a Cloud-native environment
In order to benchmark efficiency, we take a deep dive into Zarr and Parquet data retrieval to compare performance on various time scales.

-
Introducing Our Climate Change Learning Group
What is the Climate Change Learning Group? At Azavea, we’ve woven climate initiatives into the identity of our business. As one of the greatest threats to our planet’s future, climate change is something that unites and motivates our team. Recent hires at Azavea overwhelmingly cite climate work as a key motivator for joining the organization.…