Spatial Analysis
<- Return to all blogs
-
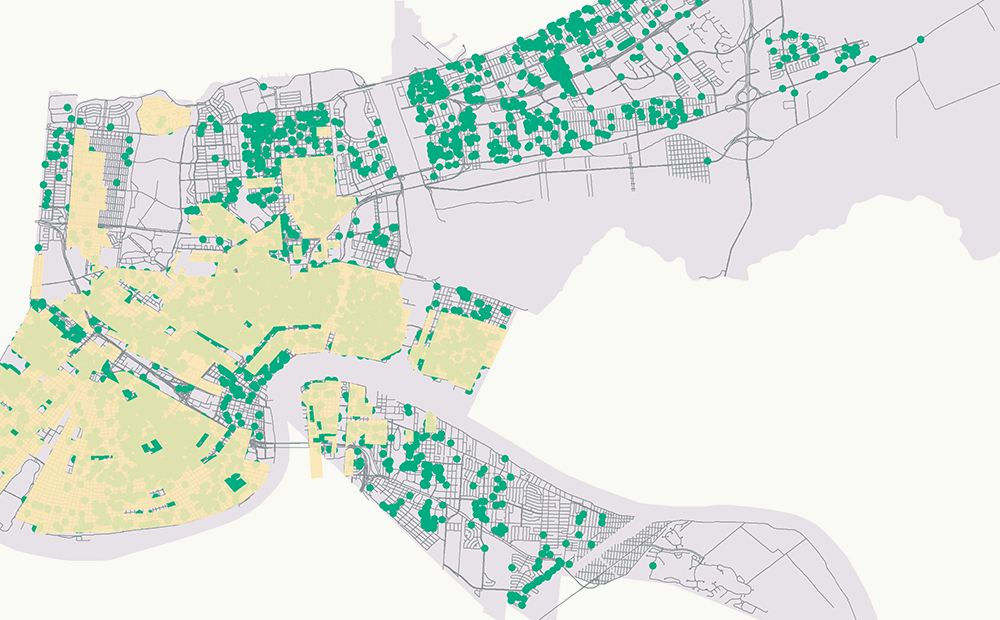
How Evictions Correspond to Past Divestment in New Orleans
We worked with Jane Place Neighborhood Sustainability Initiative as part of the 2018 Summer of Maps program to analyze evictions data in New Orleans.
-
How Evictions Correspond to Past Divestment in New Orleans
We worked with Jane Place Neighborhood Sustainability Initiative as part of the 2018 Summer of Maps program to analyze evictions data in New Orleans.
-
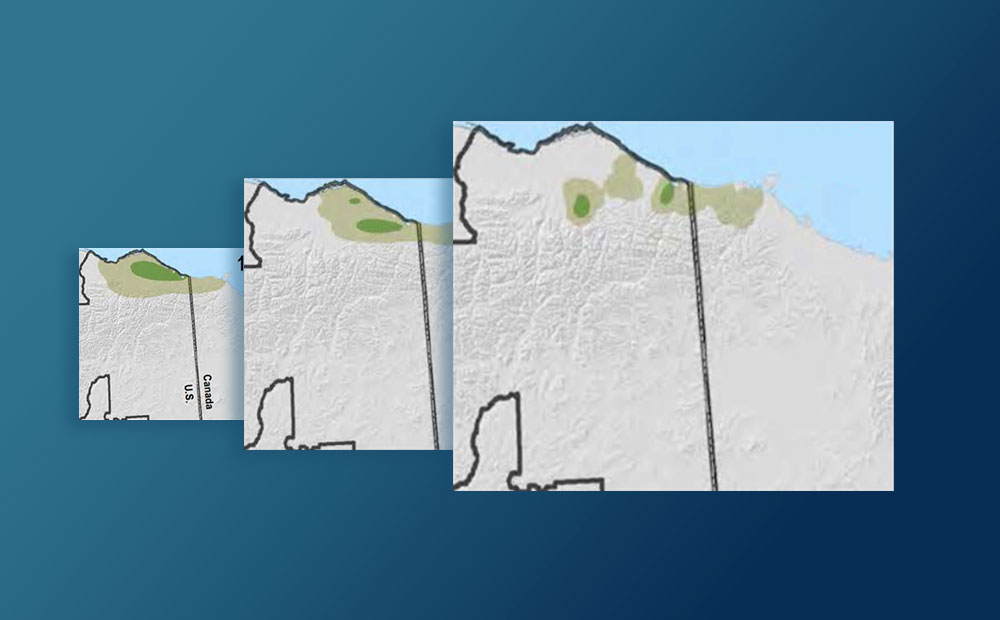
Digitizing Maps Using Remote Sensing Techniques in ArcMap and R
Learn how to use image processing and remote sensing techniques in R and ArcGIS to digitize spatial data from image or PDF files.
-
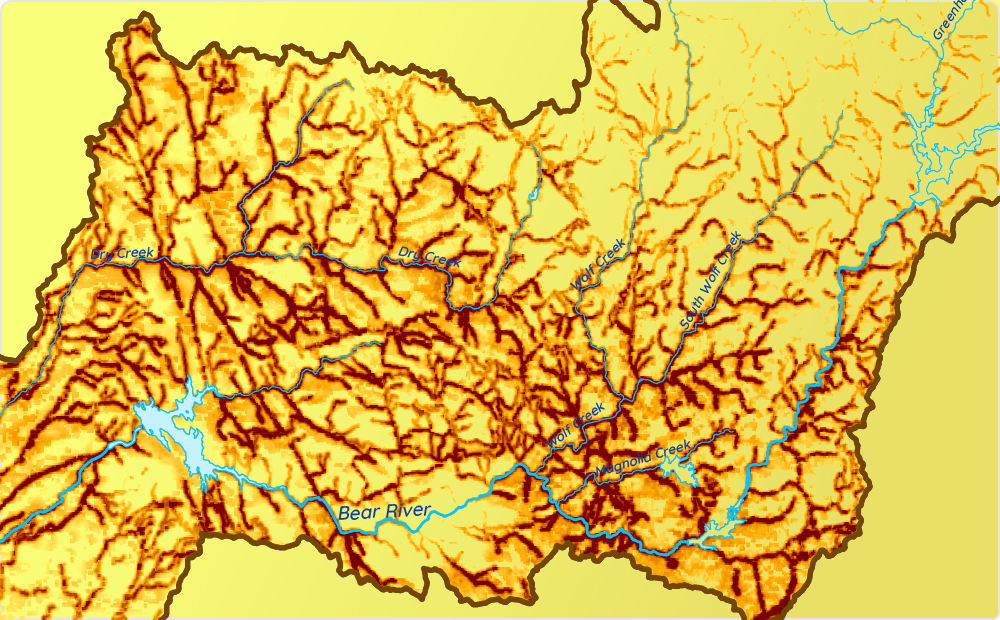
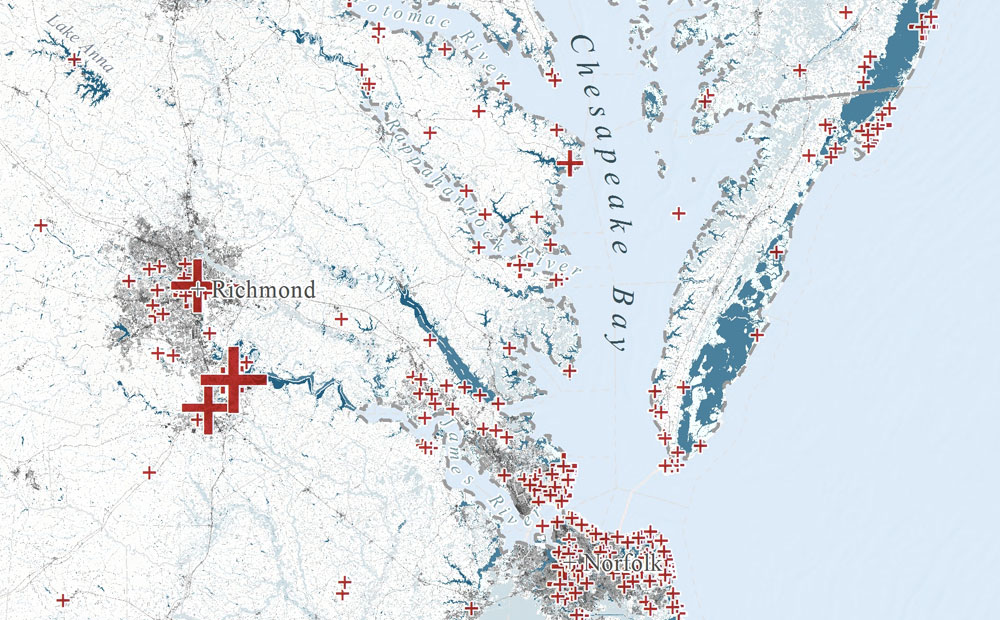
Preparing Data for MaxEnt Species Distribution Modeling Using R
How to use R to turn disparate environmental data into clean, usable raster data that can be fed into a MaxEnt species distribution model.
-
Evaluating Machine Learning Models in R: Predicting Marine Debris
Evaluating machine learning models in R with a focus on how to handle biased and imperfect data, specifically volunteer collected marine debris data.
-
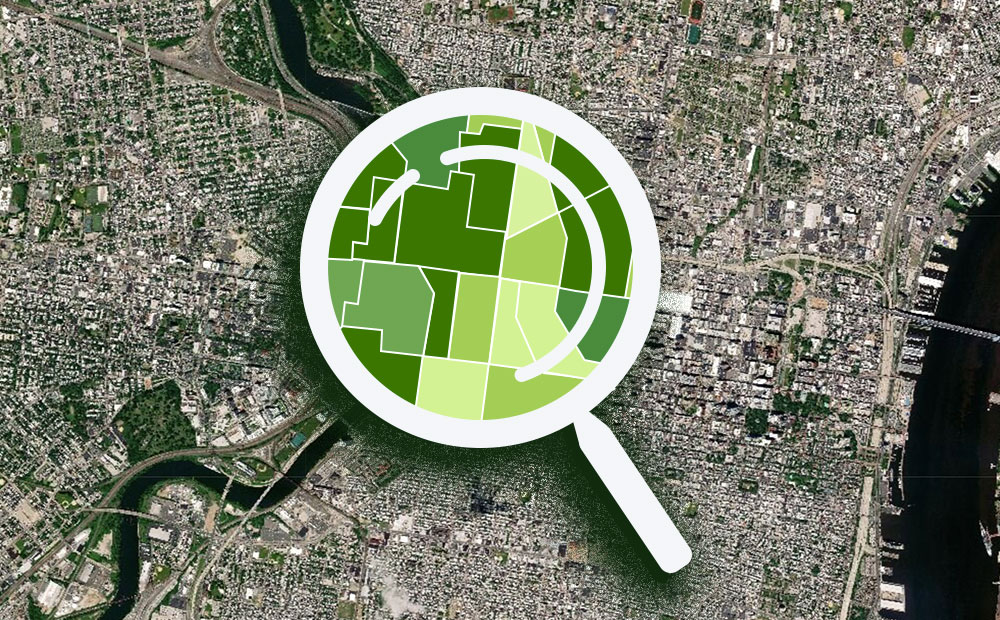
Public Redlining Exhibit Showcases Azavea’s Data Analysis Work
In September 2018, a free exhibit opened to the public on the history of redlining in Philadelphia. Read about how our Data Analytics team was involved.

-
Cleaning Philadelphia Campaign Finance Data with R
How to categorize, clean, filter, and prepare Philadelphia’s campaign finance data for analysis, mapping, and visualization.
-
Geospatial Analysis of Utility Insecurity in Philadelphia
An analysis of areas vulnerable to utility insecurity completed for the Legal Clinic for the Disabled as part of the Azavea Summer of Maps program.
-
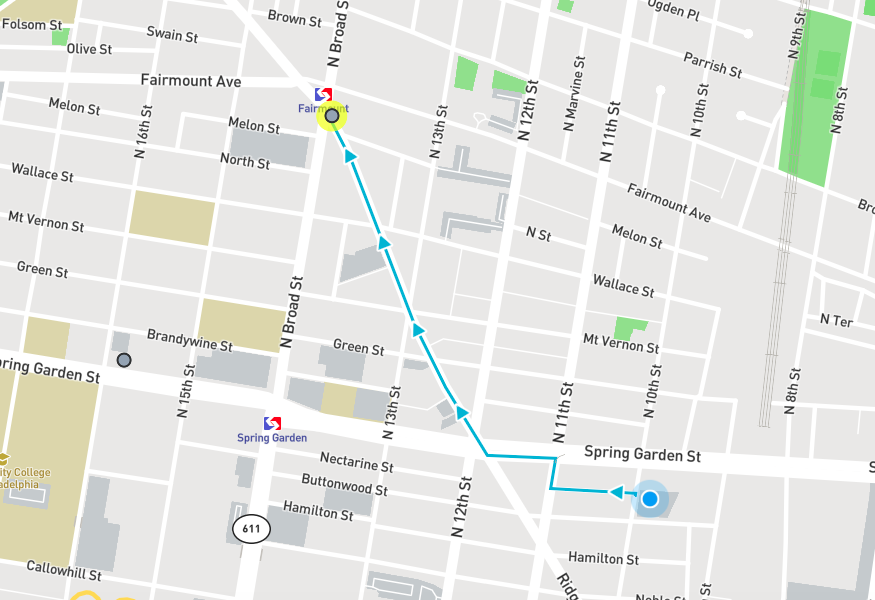
Find the Nearest Cheesesteak on National Cheesesteak Day
This web app built for National Cheesesteak Day provides walking directions to the nearest top ranked restaurant that serves cheesesteaks.
-
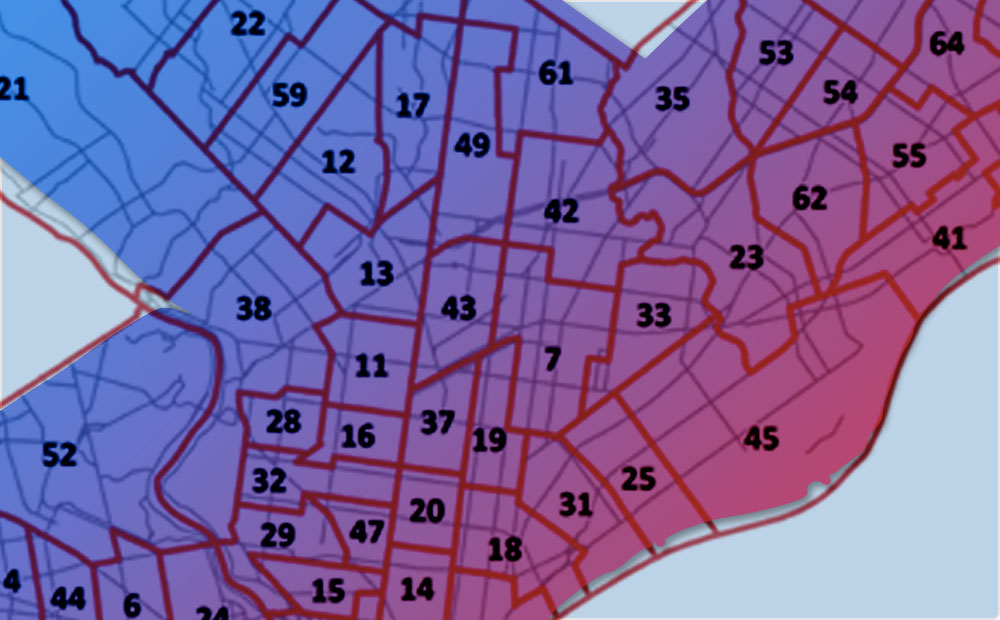
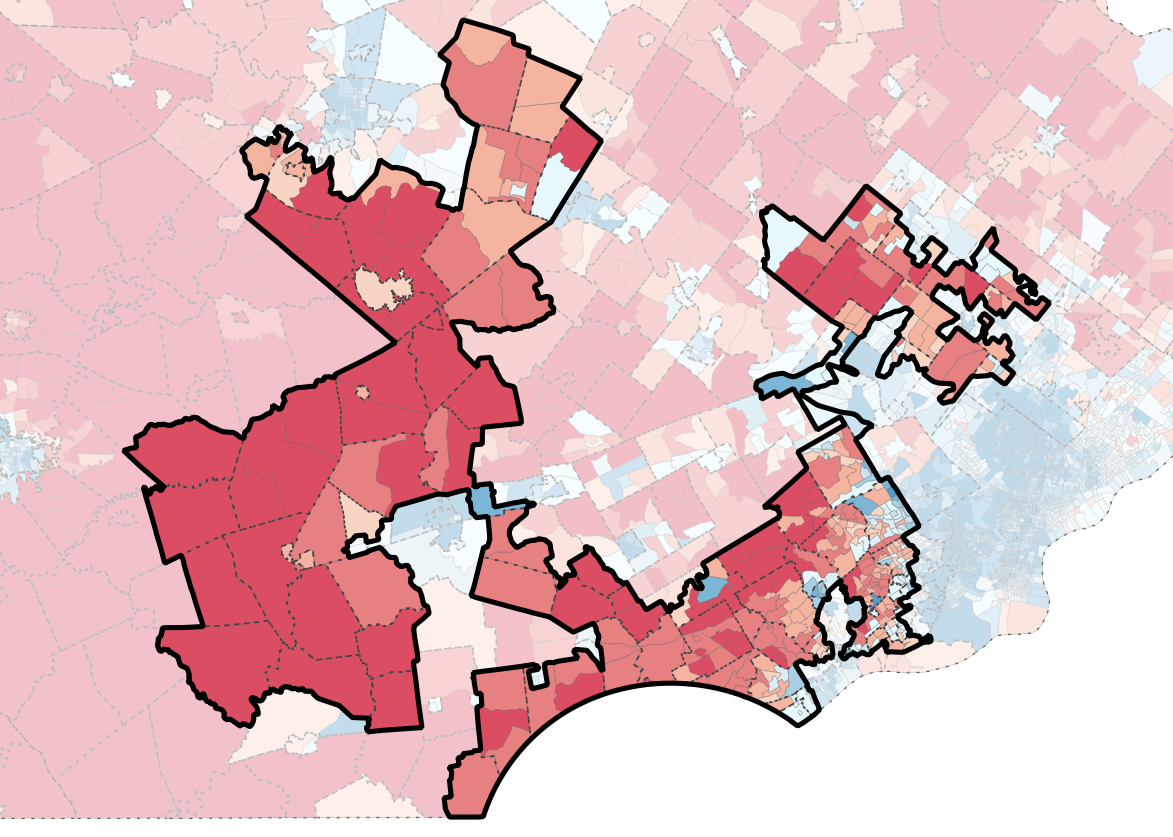
Exploring Pennsylvania’s Gerrymandered Congressional Districts
Explore Pennsylvania’s soon-to-be-defunct gerrymandered Congressional districts through info prepared for a U.S. Federal Court expert witness report.
-
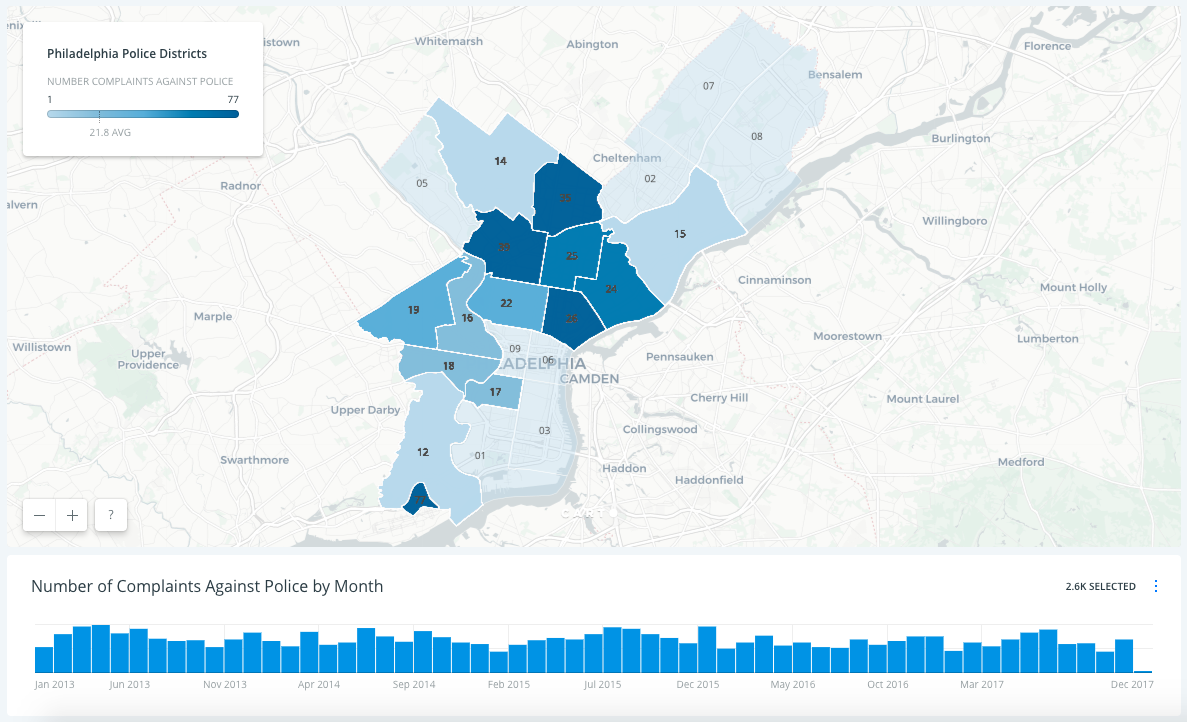
Map of Complaints Against Philadelphia Police from 2013 to 2017
This high level analysis joins newly released open data with Police Districts to create a map of Complaints Against Philadelphia Police from 2013 to 2017.