As part of our work writing a STAC + Zarr Report for the Cloud Optimized Geospatial Formats Guide our team is exploring the partially overlapping goals of STAC and Zarr and offering suggestions for how to use them together. This effort is particularly relevant currently due to several recent developments in the space that we discuss later in this post.В
Why are we excited about the interaction between Zarr and STAC now, specifically?
Neither STAC nor Zarr are particularly new, and the discussion about their overlapping capabilities and how to use them together has been going on for at least 5 years (for instance: here, here, here, here). As ESA plans to embark on large-scale data distribution in Zarr, it feels a good time to pull together best practices that have emerged over the years and how recent developments in Zarr and STAC might lead to new approaches.
Recent Developments
Zarr-3, Virtual Zarr, GeoZarr
Let’s start with the Zarr side of things. The recent release of Zarr v3 and the corresponding implementation in zarr-python includes the Sharding Codec. This means that Zarr can now store more than one chunk within a single object in S3 (this object is called a shard). This enhancement lets you avoid the exploded file hierarchy of previous Zarr versions. This is a significant advancement because requiring one API call per chunk is unwieldy for very large datasets.The new release of zarr-python also improves on this experience by implementing an async API which allows running requests concurrently.
Between Zarr-3, the advent of Icechunk, and recent development on VirtualiZarr there has also been increased interest in virtual Zarr stores recently. Virtual zarr stores (traditionally stored as kerchunk reference files, but now also as Icechunk stores) let data consumers access data from legacy chunked file formats (such as NetCDF and HDF5) as if they were zarr stores (read more about why these formats don’t natively work well in the cloud in Tom Nicholas’ excellent blog post). The takeaway is that users can have cloud-optimized workflows without all the data duplication that is implied by moving data to Zarr.
While this has been going on in the regular Zarr world, the GeoZarr working group has also been cooking up a specification for encoding geospatial data in Zarr (Max Jones’ slides from STAC + Zarr workshop Apr, 2025) – remember that regular Zarr is for any kind of array – similar to how TIFF is for any type of raster while GeoTiff is specifically spatial.
xarray.DataTree
Meanwhile in xarray, xarray.DataTree was merged in as a core data structure. This is an important missing piece because xarray is an essential part of the experience of working with multidimensional data arrays in Python. The DataTree structure lets you construct hierarchies of groups of arrays that have different dimensions and/or resolutions. If you think that sounds like Zarr, you are right. The incorporation of DataTree as a core structure within xarray, means that Zarr is now, officially, a first class citizen.
STAC Collection Search and Link Templates Extension
Typically “searching” in STAC means searching through the items in a catalog. But the STAC API also has an extension defining collection-level search which allows flexible search through the collections in a catalog. Recently collection search has been added to stac-fastapi which makes it easier than ever for STAC catalogs to support it. Support has also been added to pystac-client which makes it easier for users to take advantage of this new functionality. Collection search is great for discovering datasets of interest – even over multiple STAC Catalogs (this is called federated search: here is an example).
Also on the STAC side there has been recent work on Qubed, which is being formalized in the Link Templates Extension. One of the goals of this work is to improve the browsability of nested structures by providing a succinct pattern for referencing a nested path. This has applications for Zarr because it allows direct access to data within subgroups.
Now that we’ve covered recent developments let’s zoom out a bit and get into why it has been challenging to figure out how to use Zarr and STAC together.
How do STAC and Zarr compare?
STAC is a specification for indexing and finding any type of data that has spatial and temporal dimensions. STAC builds off geojson and is often used to store references to satellite imagery stored in COGs.
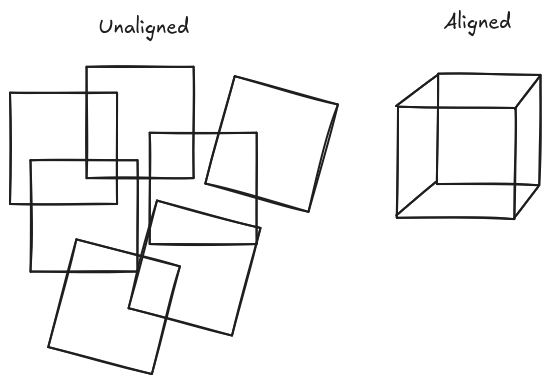
The Zarr specification is designed to store self-describing hierarchies of chunked multidimensional arrays. It is often used for storing outputs from earth system models. These datasets tend to be on well-aligned grids representing global regions.
Both STAC and Zarr support flexible hierarchies of arbitrary metadata, and they share overlapping goals. The main thing to keep in mind is that Zarr is a data format and STAC is not. Sometimes we conflate “STAC” with “COGs stored in a STAC catalog”, but STAC can be used to catalog anything as long as it has spatiotemporal dimensions.
| STAC | Zarr ( + xarray for last 2 rows) |
|---|---|
| for data with spatial and temporal dimensions | for groups of arrays with any type of dimensions |
| supports arbitrary metadata for catalogs, collections, items, assets | supports arbitrary metadata for groups, arrays |
| storage of STAC metadata is completely decoupled from storage of data | storage of metadata is coupled to data (i.e., in the same directory, except when virtualized) |
| good for discovering datasets of interest | good for filtering within a dataset |
| searching returns STAC items or collections | filtering returns subsets of arrays (potentially composed of parts of multiple chunks) |
Although they have many similarities, Zarr does not have a catalog concept. There is nothing above the Zarr store. Data providers have a responsibility to make their data discoverable and in order to do that you have to have a means for people to find it and figure out what is in it. That’s where STAC comes in.
How can Zarr + STAC help Data Consumers?
Data consumers have questions like:
- How can I discover datasets that might be applicable to my work?
- I know I want to use a particular dataset – but where can I find it and how do I access it?В
A Zarr store sitting on S3 is not enough to answer either of these questions by itself. The data is open, but it isn’t discoverable. Users would have to already know what and where their data is.
That said, if the same Zarr store were indexed in a STAC Catalog you could search using a term like “sea surface temperature” and find the Zarr store along with information about how to access it.
How can Zarr + STAC help Data Producers?
In contrast to consumers, data producers are focused on ensuring that their data is up-to-date and minimizing the number and size of requests that are required for people to use it. They need to decide where Zarr stores should go in a STAC catalog, and what metadata should be duplicated from the Zarr dataset into STAC.
The appropriate decision given any of the above considerations will vary based on, among other things, the shape of the data being considered. There is no easy, one-size-fits-all solution.
These drawings are a simplification, since in reality you likely have 4D data or possibly many data cubes at different resolutions.
One Big Zarr (Aligned Data)
This is what people tend to think of when they think of Zarr data. These include the ERA5 or CMIP6 datasets that are typically global in scale and have many subgroups. In data processing terms these are Level 3 and Level 4 data.
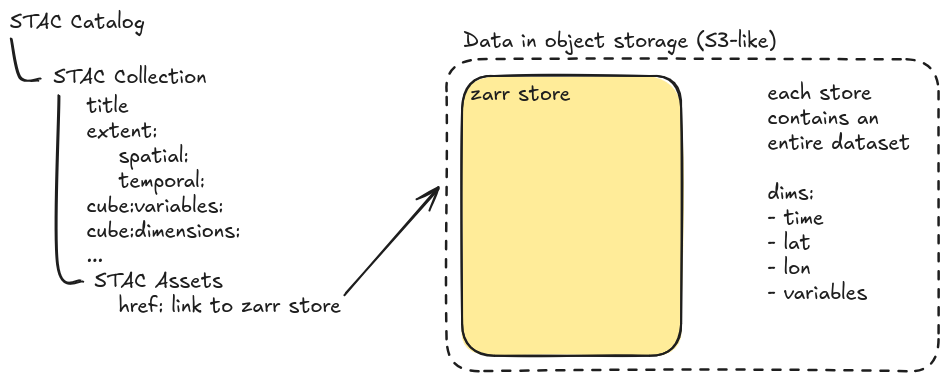
In this scenario, there is a collection for each dataset with a collection-level asset containing a reference to the Zarr store. There are no STAC Items at all.
The simplest implementation of One Big Zarr is just this: a collection with no metadata and an asset pointing to the Zarr store on S3. This is already useful! It provides a single location (STAC) where users can find how to access many datasets and without any metadata duplication!
Even so, without metadata the dataset isn’t as discoverable as it could otherwise be.
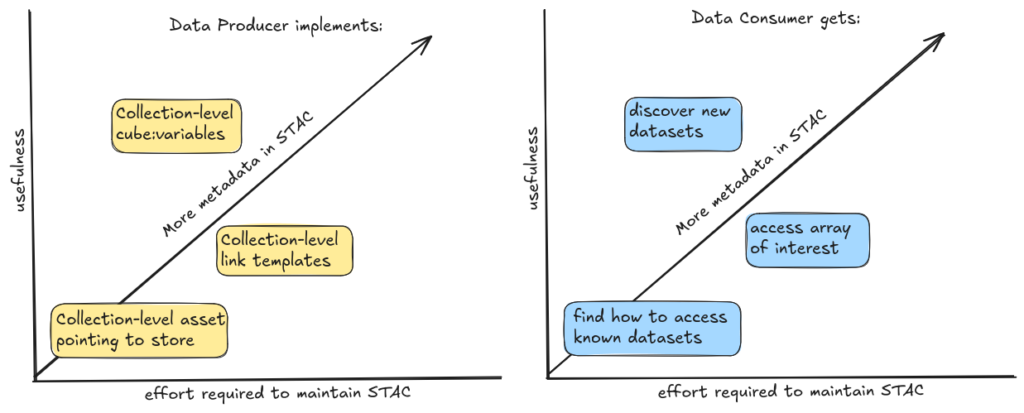
To improve discoverability, data producers can use the Datacube Extension to capture the variables contained within the Zarr store. Tom Augspurger even made a tool – xstac – for extracting STAC metadata from xarray objects. This metadata doesn’t change very often, so it is reasonable to maintain and providing it enables users to find new datasets by searching a particular topic (like “sea surface temperature”).
In this scenario, STAC metadata is purely used for search and discovery, and cannot be used for filtering.
Many Smaller Zarrs (Unaligned Data)
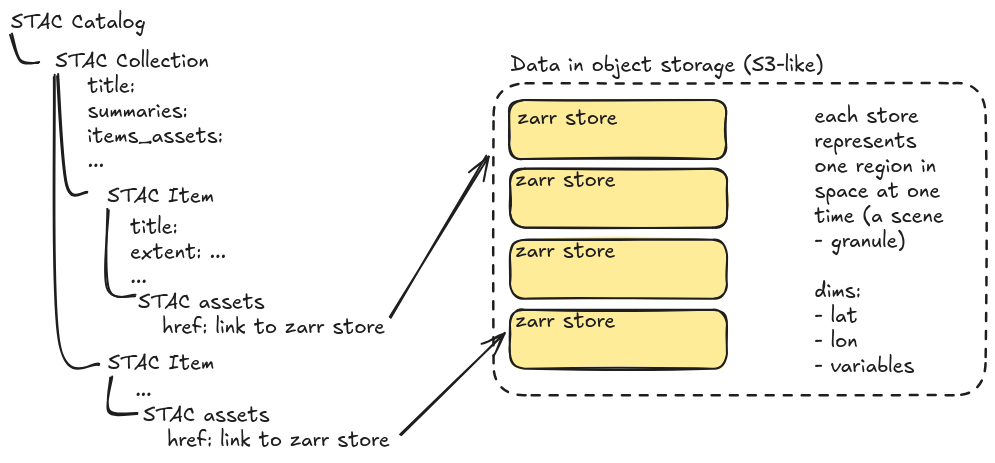
This setup is similar to the common “STAC + COGs” approach, but instead of having one COG per temporal and spatial extent (in satellite terminology: one scene), there is one Zarr store for the scene. This approach works well for unaligned data where each Zarr store might cover a small portion of the globe and have a different coordinate reference system than another Zarr store. This is typically what data looks like at data processing levels 1 and 2.
In this scenario the STAC Collection represents the whole dataset (for instance Sentinel-2 L2A) and under that collection there are STAC Items representing each scene with an asset pointing to the Zarr store for that scene. Each STAC Item should specify the spatial and temporal extents of the data so that data consumers can determine which Zarr stores they need.
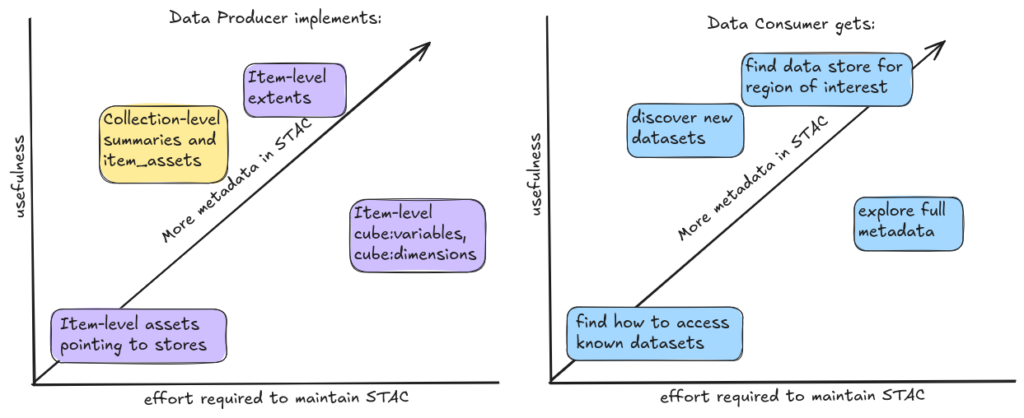
Once you have item-level assets and item-level extents the Zarr stores are indexed and usable, but to make the data discoverable you can add collection-level summaries and item_assets.These metadata are unlikely to change often so they shouldn’t take much to maintain and they allow users to search for datasets containing variables of interest.В
Additional item-level metadata should be included if it is not already contained within the Zarr store (provenance, for example) or if it is useful for search.
Cloud Optimized Geospatial Formats Guide
Recently, members of our team at Element 84, in conjunction with folks at Development Seed, have been writing a STAC + Zarr Report for the Cloud Optimized Geospatial Formats Guide. This guide is an existing resource hosted by the Cloud Native Geospatial community that provides a wealth of information for anyone looking to learn about best practices for using geospatial data in the cloud. The new report goes into more detail from both the data producer and consumer side, and you can view the full document (still in development) here.В
If you’d like to chat more about using STAC and Zarr in your work, our team would love to connect! You can find us any time through our contact us page.
Acknowledgements
The STAC + Zarr Report that this blogpost came out of was supported by NASA IMPACT as part of the VEDA project. In particular I got tremendous support from my colleagues at Development Seed (Max Jones, Pete Gadomski, Henry Rodman, Emmanuel Mathot,В Aimee Barciauskas, Sean Harkins), my Element 84 coworkers (Matt Hanson, Nathan Zimmerman, Sara Mack), and from Matthias Mohr. I also benefited from the pioneering work of Tom Augspurger on pushing the limits of STAC in the context of Planetary Computer.