Earlier this year, in July 2025, Google DeepMind contributed to the conversation on Earth Observation (EO) foundation models and vector embeddings by releasing a dataset of EO vector embeddings generated by their new AlphaEarth Foundations (AEF) model. Originally released only inside Google Earth Engine, these embeddings were finally made publicly and freely available on Source Cooperative, through an incredible community effort, in November 2025.
The AlphaEarth embeddings stand out from other EO vector embeddings by virtue of being pixel-level rather than patch-level. This makes them more suited for dense prediction tasks like image segmentation. It is also interesting to see what other insights can be extracted from just these embeddings without any additional training. In this blog post, we take a closer look at these embeddings and explore their usefulness for tasks such as classification, similarity search, and change detection.
Pixel-level Embeddings
The broader goal of creating and distributing EO vector embeddings at scale is to preprocess raw remote sensing data to extract rich semantic information from it in order to simplify downstream analysis. A major decision point in attempting to do this is deciding what unit of data will the foundation model process and create an embedding for. A pixel? An image patch? A time series of pixels? A spatiotemporal data cube? Different EO foundation models take different approaches for this and each has its upsides and downsides. The AEF answer to the question is, in some sense, “all of the above.”
The AEF model takes in a spatiotemporal data cube and outputs a single 64 dimensional embedding for each spatial pixel. This means that the embeddings for each pixel encodes not only the pixel’s temporal characteristics but also information about its neighboring pixels. This latter property means that unlike embeddings from a naive pixel-level model, the embeddings are “spatially aware”, allowing them to potentially encode semantic information about visual features larger than a pixel.
The current AEF embeddings dataset comprises annual global embedding maps for the years 2018 through 2024.
What’s in an Embedding?
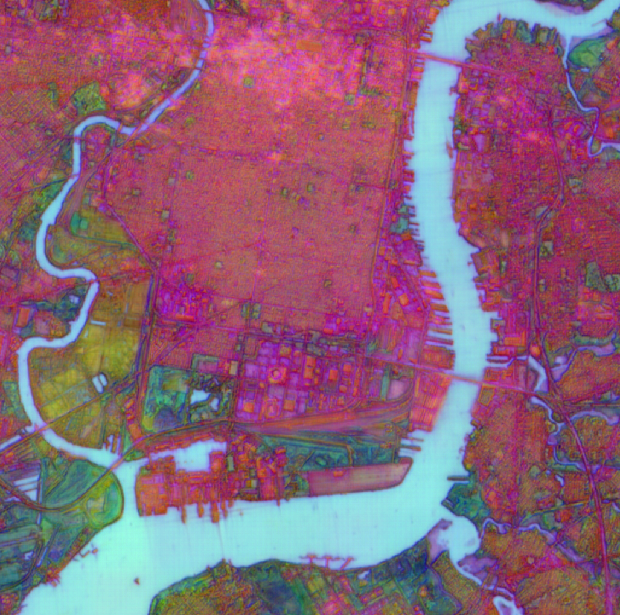
One of the most fun things you can do with any dataset is to actually look at it. Granted, vector embeddings are not supposed to be directly human interpretable but that shouldn’t stop us from having a go at it anyway. Since these are pixel-level embeddings, we can visualize each individual dimension as a separate raster to see what kind of information each dimension specializes in encoding. Below, we do this for the 2024 AEF embeddings over Philadelphia.
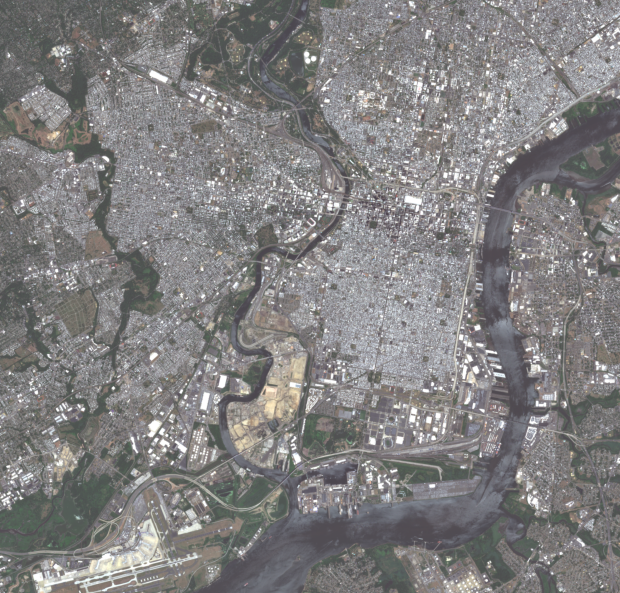
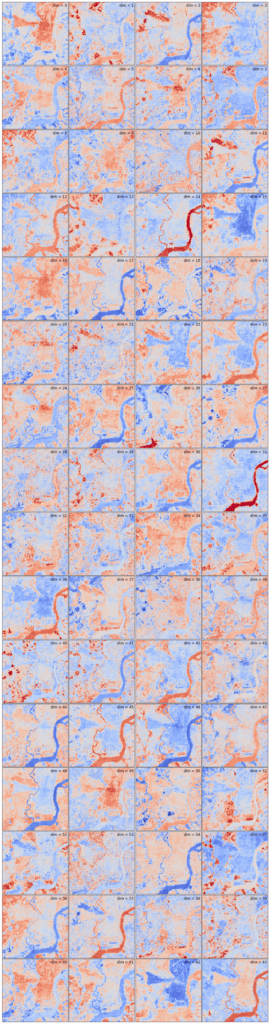
We can clearly see some dimensions encoding broad concepts classes such as “water”, “vegetation”, and “urban”. Dimension 51 seems to roughly correspond to “industrial area”, while dimensions 6, 20, and 24 seem to respond most strongly to “tall buildings”. It is also interesting how various dimensions such as 0 and 62 make such a strong distinction between the conical area in West Philly roughly situated between Lancaster Ave and Baltimore Ave and the surrounding area. Inspecting the satellite imagery more closely, the main distinction seems to be the angle of the street grid.
And then there is dimension 26.
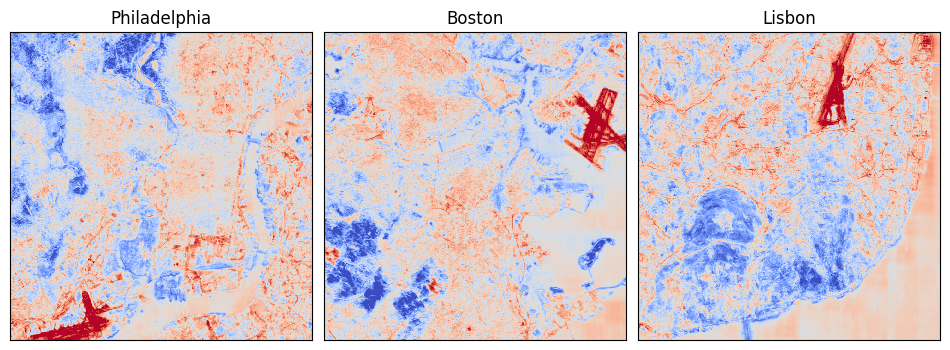
An airport dimension?
Perhaps the most remarkable, and amusing, observation is that the 27th dimension (dim 26 in the image above) seems to respond strongly to pixels located over the airport. Could it be that this dimension has specialized in detecting airports? To validate this hypothesis, we checked the embeddings over a couple of other cities and found that the observation held. This seems to be a clear case where the spatially-aware nature of the AEF embeddings can be seen in play, encoding coarser semantic information at the pixel level.
Classification
We already know from the AEF paper that the embeddings work well for downstream pixel-level classification (AKA segmentation) tasks, but it is still interesting to see how they perform on a messy, real-world, non-benchmark dataset. Below, we show the predictions from a linear logistic regression classifier trained on a tiny subset of the Living England Habitat Map to detect bracken, a type of fern invasive to some regions. We see that the predictions look remarkably good for how little effort was put into this. This might also be a case where the embeddings’ temporal nature helps by encoding seasonal and phenological trends for the vegetation in question.
Cosine Similarity Is All You Need?
We know that we can train a lightweight model on top of the AEF embeddings to do land cover classification, but can we be even lazier? How far can we get with mere vector similarity search? In the examples below, we test this out by choosing a single reference pixel in the image and inspecting the similarity between it and the rest of the pixels in the image.
It turns out that for “water” at least this works remarkably well as seen below.
“Vegetation” seems to also work fairly well, though there do seem to be more false positives, especially in the eastern portion of the image.
Another interesting observation about the similarity maps above is that the similarity doesn’t “bleed out” into the pixels close to the target pixels. Since the AEF embeddings are spatially aware, one might expect there to be a certain amount of fuzziness such that non-water pixels next to water pixels might be more similar to water pixels than non-water pixels further away. But this turns out to not be the case, and, instead, we see sharp transitions.
Change Intensity Maps
Change detection is one of the most important EO concerns. Until now, obtaining fine-grained change intensity maps has only been possible through specialized change detection models which are hard to train and do not always generalize well across disparate geographical regions. We have explored vector-embedding-based change detection in the past, but that too has been limited to detecting patch-level changes, and thus, a much lower resolution.
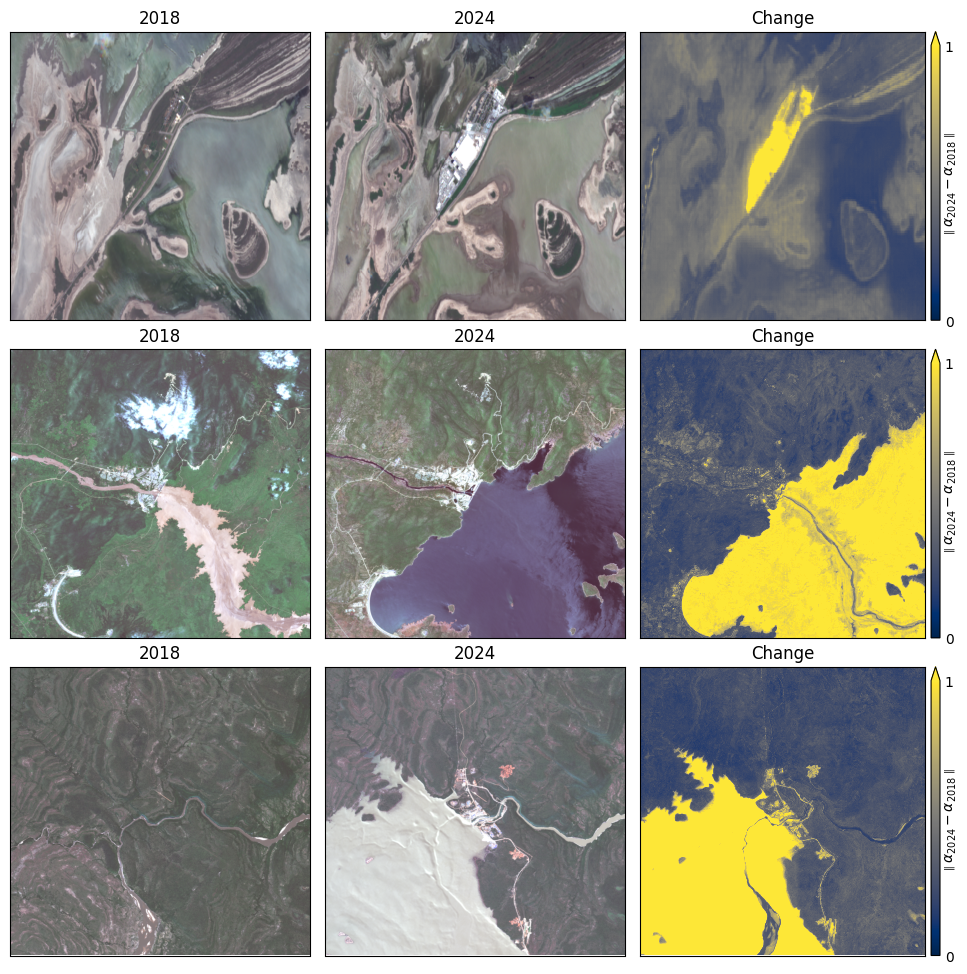
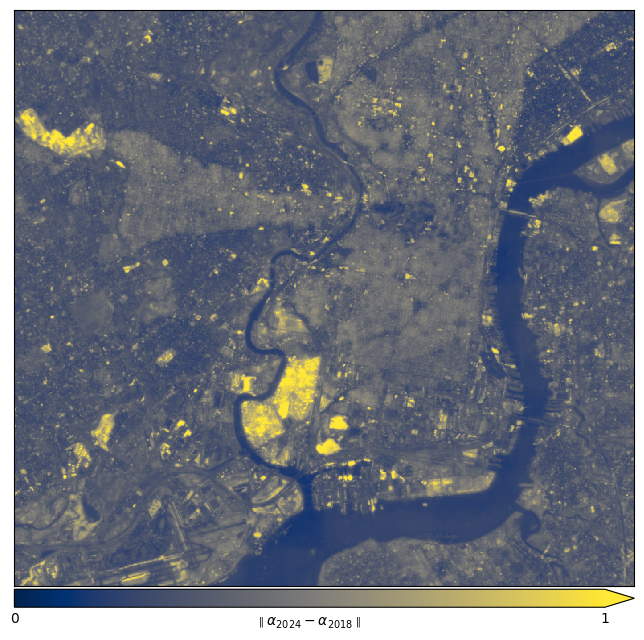
But now that we have pixel-level embeddings, can we do better? Can we obtain pixel-level change intensity maps for essentially free? In the examples below, we try a simple approach where we compute the magnitude of the difference vector between each pixel’s embeddings from two different years (2018 and 2024) and visualize the result as a raster. We find that this works as expected.
In the examples below, we see that it works well for detecting permanent change in the landscape caused by large construction projects.
A more fine-grained example: urban change in Philadelphia:
Here is what the biggest of these changes look like in the actual imagery. Note that the images are single snapshots from the respective years, while the embeddings were computed from a time series of multiple images from each year covering all seasons, so the change intensities are not necessarily a measure of the difference between these two particular images.
We suspect that this approach will likely not work as well for short-lived phenomena such as floods or wildfires, since the model might treat those temporary changes as noise and not encode them in the embeddings. At the very least, it might be hard to figure out from annual embeddings exactly when the changes occurred.
What’s next for AlphaEarth Embeddings?
It is clear that the AEF embeddings are very capable and unlock a bunch of new exciting downstream applications. We conclude with the following open questions:
- While Google has released precomputed AEF embeddings, the AEF model and training code are not open source. Should we rely on Google to continue making future releases?
- Are the AEF embeddings significantly better than open source models like TESSERA, also released this year, that also produce pixel-level embeddings but which are not spatially aware?
- Annual change intensity maps like the ones shown above seem very useful; does it make sense to create and distribute pre-computed change maps as a new data product?
What do you think? Do you have any questions or ideas about AlphaEarth embeddings that you would like to see explored? Do you have a use case that could benefit from these or similar embeddings? Do you have ideas for useful new data products that could be derived from these embeddings? Let us know!
Want to learn more about EO vector embeddings and their uses? Check out our whitepaper.