Geospatial
<- Return to all blogs
-
Which Congressional Districts are Over and Under Populated
We calculated which congressional districts have become over or underpopulated since they were last drawn.
-
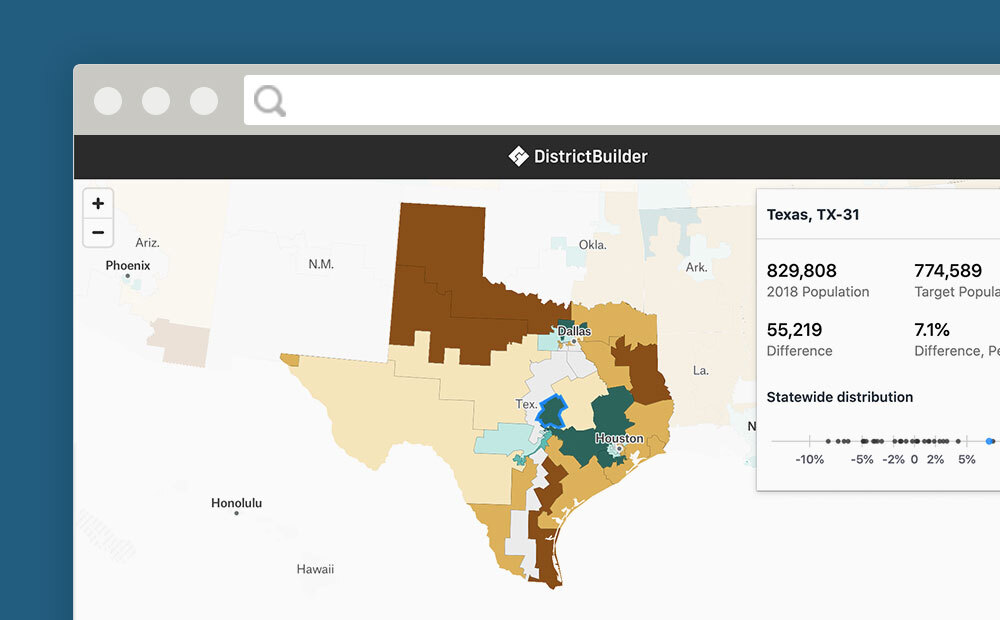
Which Congressional Districts are Over and Under Populated
We calculated which congressional districts have become over or underpopulated since they were last drawn.
-
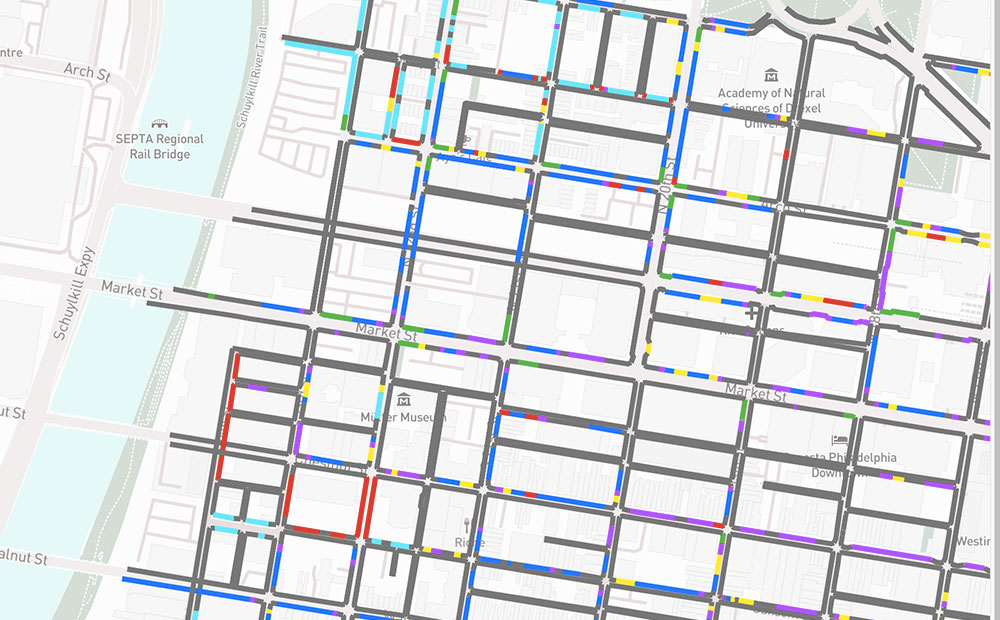
Maintaining Data on the Curb with CurbLR: A New Open Standard
CurbLR is a promising new open data specification for curb regulation. We used it to visualize and analyze Philadelphia’s curb management approaches affect on traffic.
-
How We Built a National Hospital Dataset for Coronavirus Relief
We pulled data from disparate hospital data sources to create a comprehensive national dataset of the hospital system for the COVID-19 response, using geocoding, proximity matching, and fuzzy string matching.
-
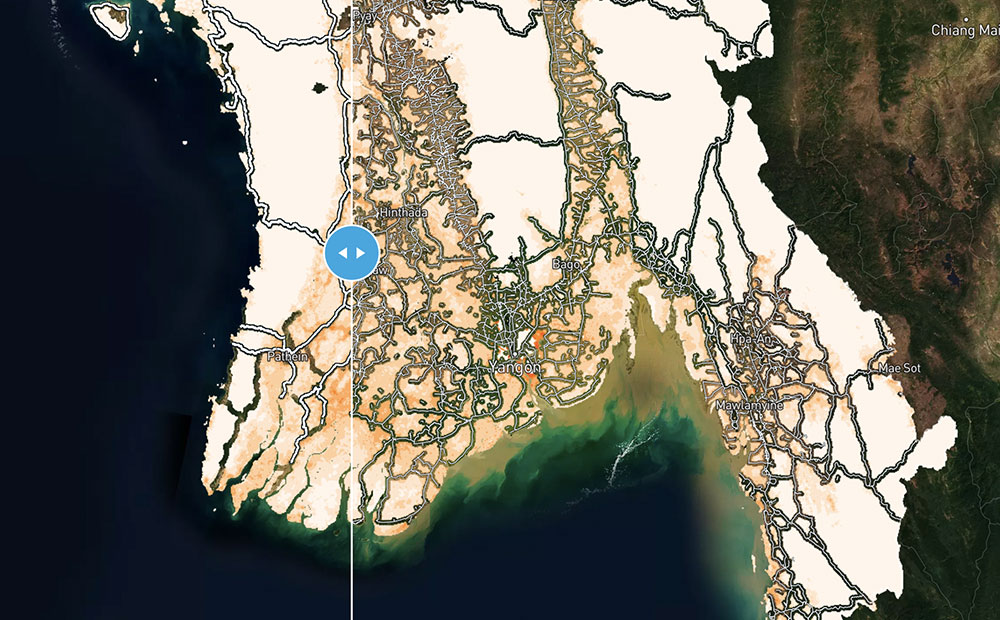
Calculating Rural Road Access Globally Using Open Datasets
We used three open datasets to calculate the number of people in the world who do not have sufficient access to a road in an effort to move forward the conversation on the Rural Access Indicator (RAI).
-
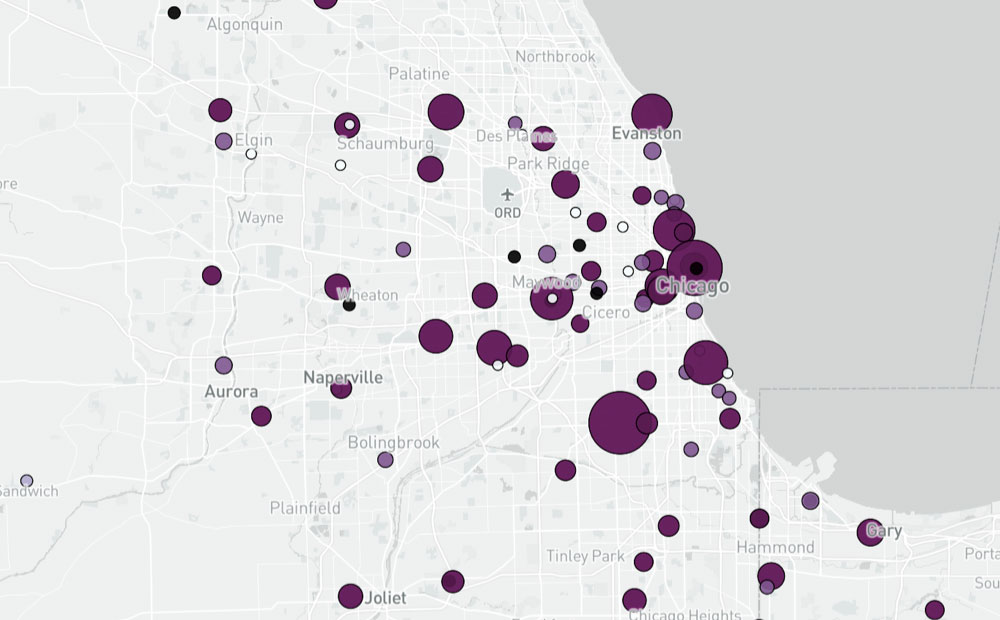
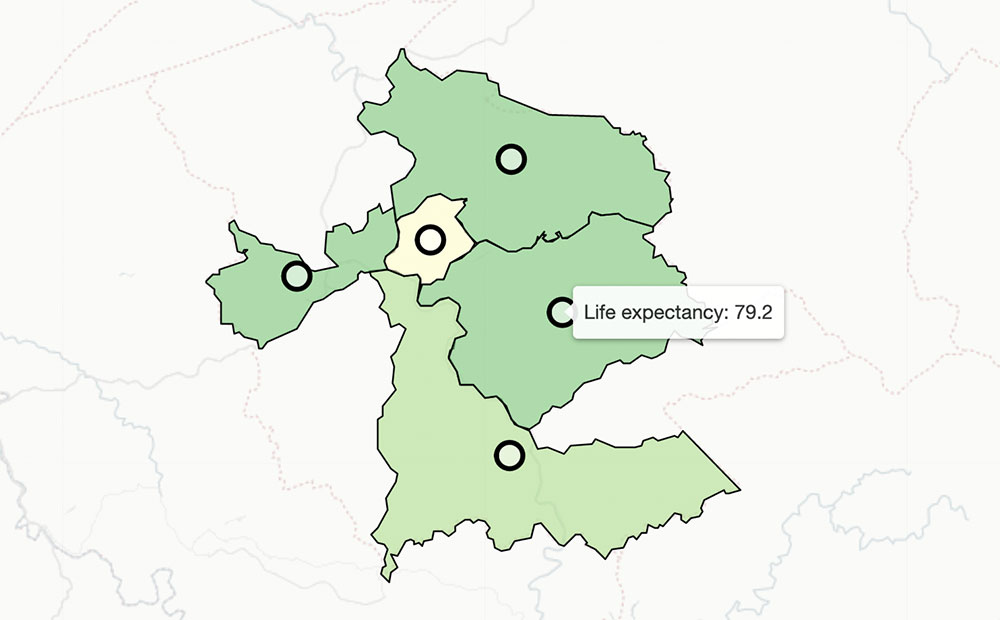
Analyzing Spatial Patterns in Life Expectancy with Python
All around the country boundaries separate neighborhoods with high and low life expectancy. We used python to find the most extreme examples.
-
Blacksburg, VA Finds Their “TurboTax™ for Climate Vulnerability Assessments” in Temperate
This case study showcases how Temperate is uniquely poised to walk cities through the confusing process of conducting a climate vulnerability assessment.

-
Scoring Philadelphia’s City Council Districts for Children’s Health and Well-being
Scoring Philadelphia City Council districts on assets and risks using a weighted spatial analysis model in R and Python.

-
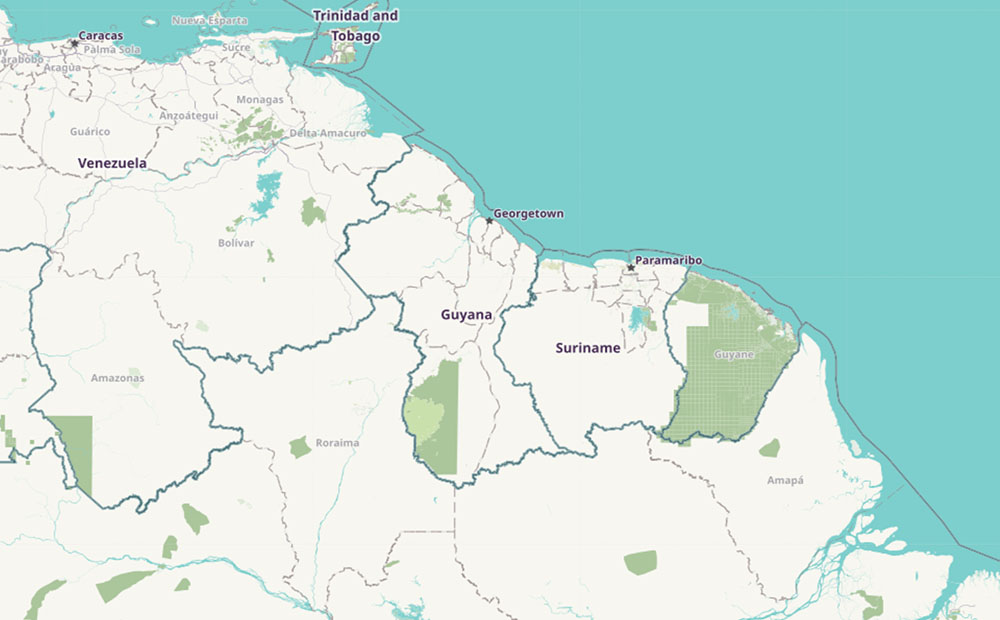
Enhancing GIS Capacity with OpenStreetMap
We’re working with the Inter-American Development Bank to improve the GIS capacity of Guyana with tools built to extract OpenStreetMap data.
-
Using ArcMap, R, and Adobe Illustrator to Create Data Driven Infographics
Learn to create a series of data-driven infographics in the context of a project that evaluates bus performance in each Philadelphia City Council District.

-
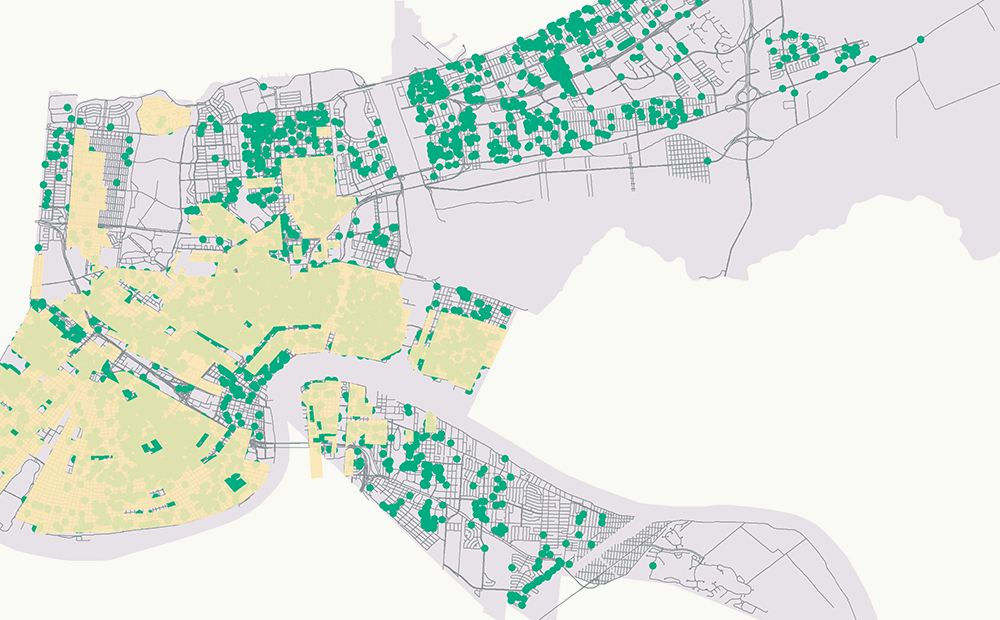
How Evictions Correspond to Past Divestment in New Orleans
We worked with Jane Place Neighborhood Sustainability Initiative as part of the 2018 Summer of Maps program to analyze evictions data in New Orleans.