All blog posts
<- View categories
-
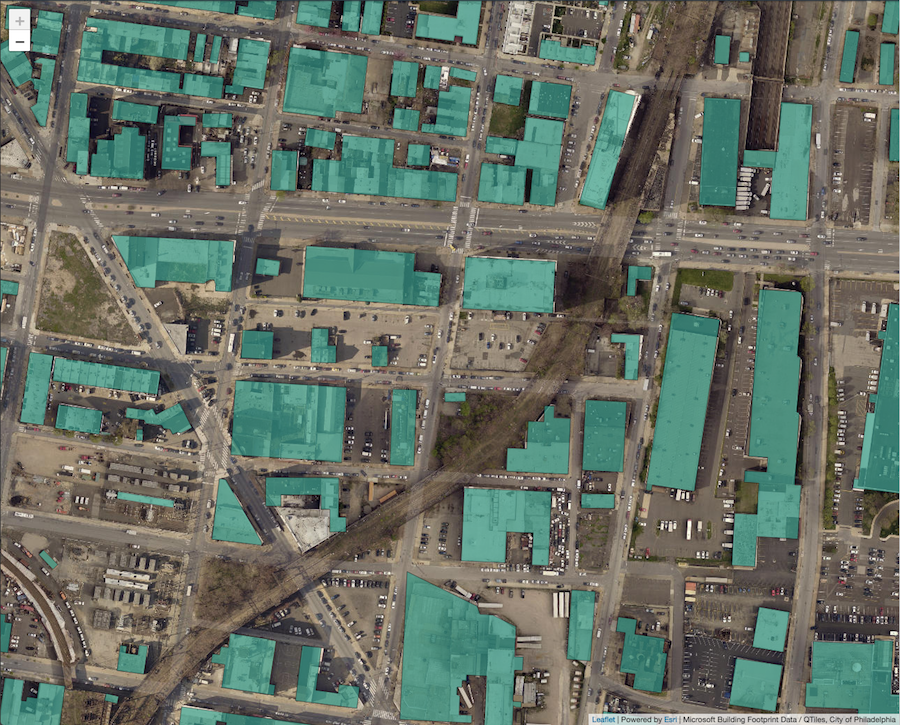
E84 Lab Notes: Machine Learning with RoboSat
Recently, the E84 R&D team has been experimenting with machine learning pipelines and identifying potential use cases. There are a lot of new and exciting tools out there and we’re interested in exploring what’s available, particularly tools related to satellite and aerial imagery (one of our specialties). Mapbox‘s RoboSat was released earlier this year and…
-
Enhancing the Pangeo Community with NASA Earth Observing System (EOS) Data
One of our main missions at Element 84 is to help reduce the amount of time that researchers (scientific and corporate, alike) spend wrangling, downloading, cleaning, and prepping data in pursuit of their primary research question. A recent NASA study put that number at around 60%–leaving less than half of a scientist’s time available for…
-
Raster Vision: A New Open Source Framework for Deep Learning on Satellite and Aerial Imagery
Azavea is pleased to announce the release of Raster Vision, a new open source framework for deep learning on satellite and aerial imagery.

-
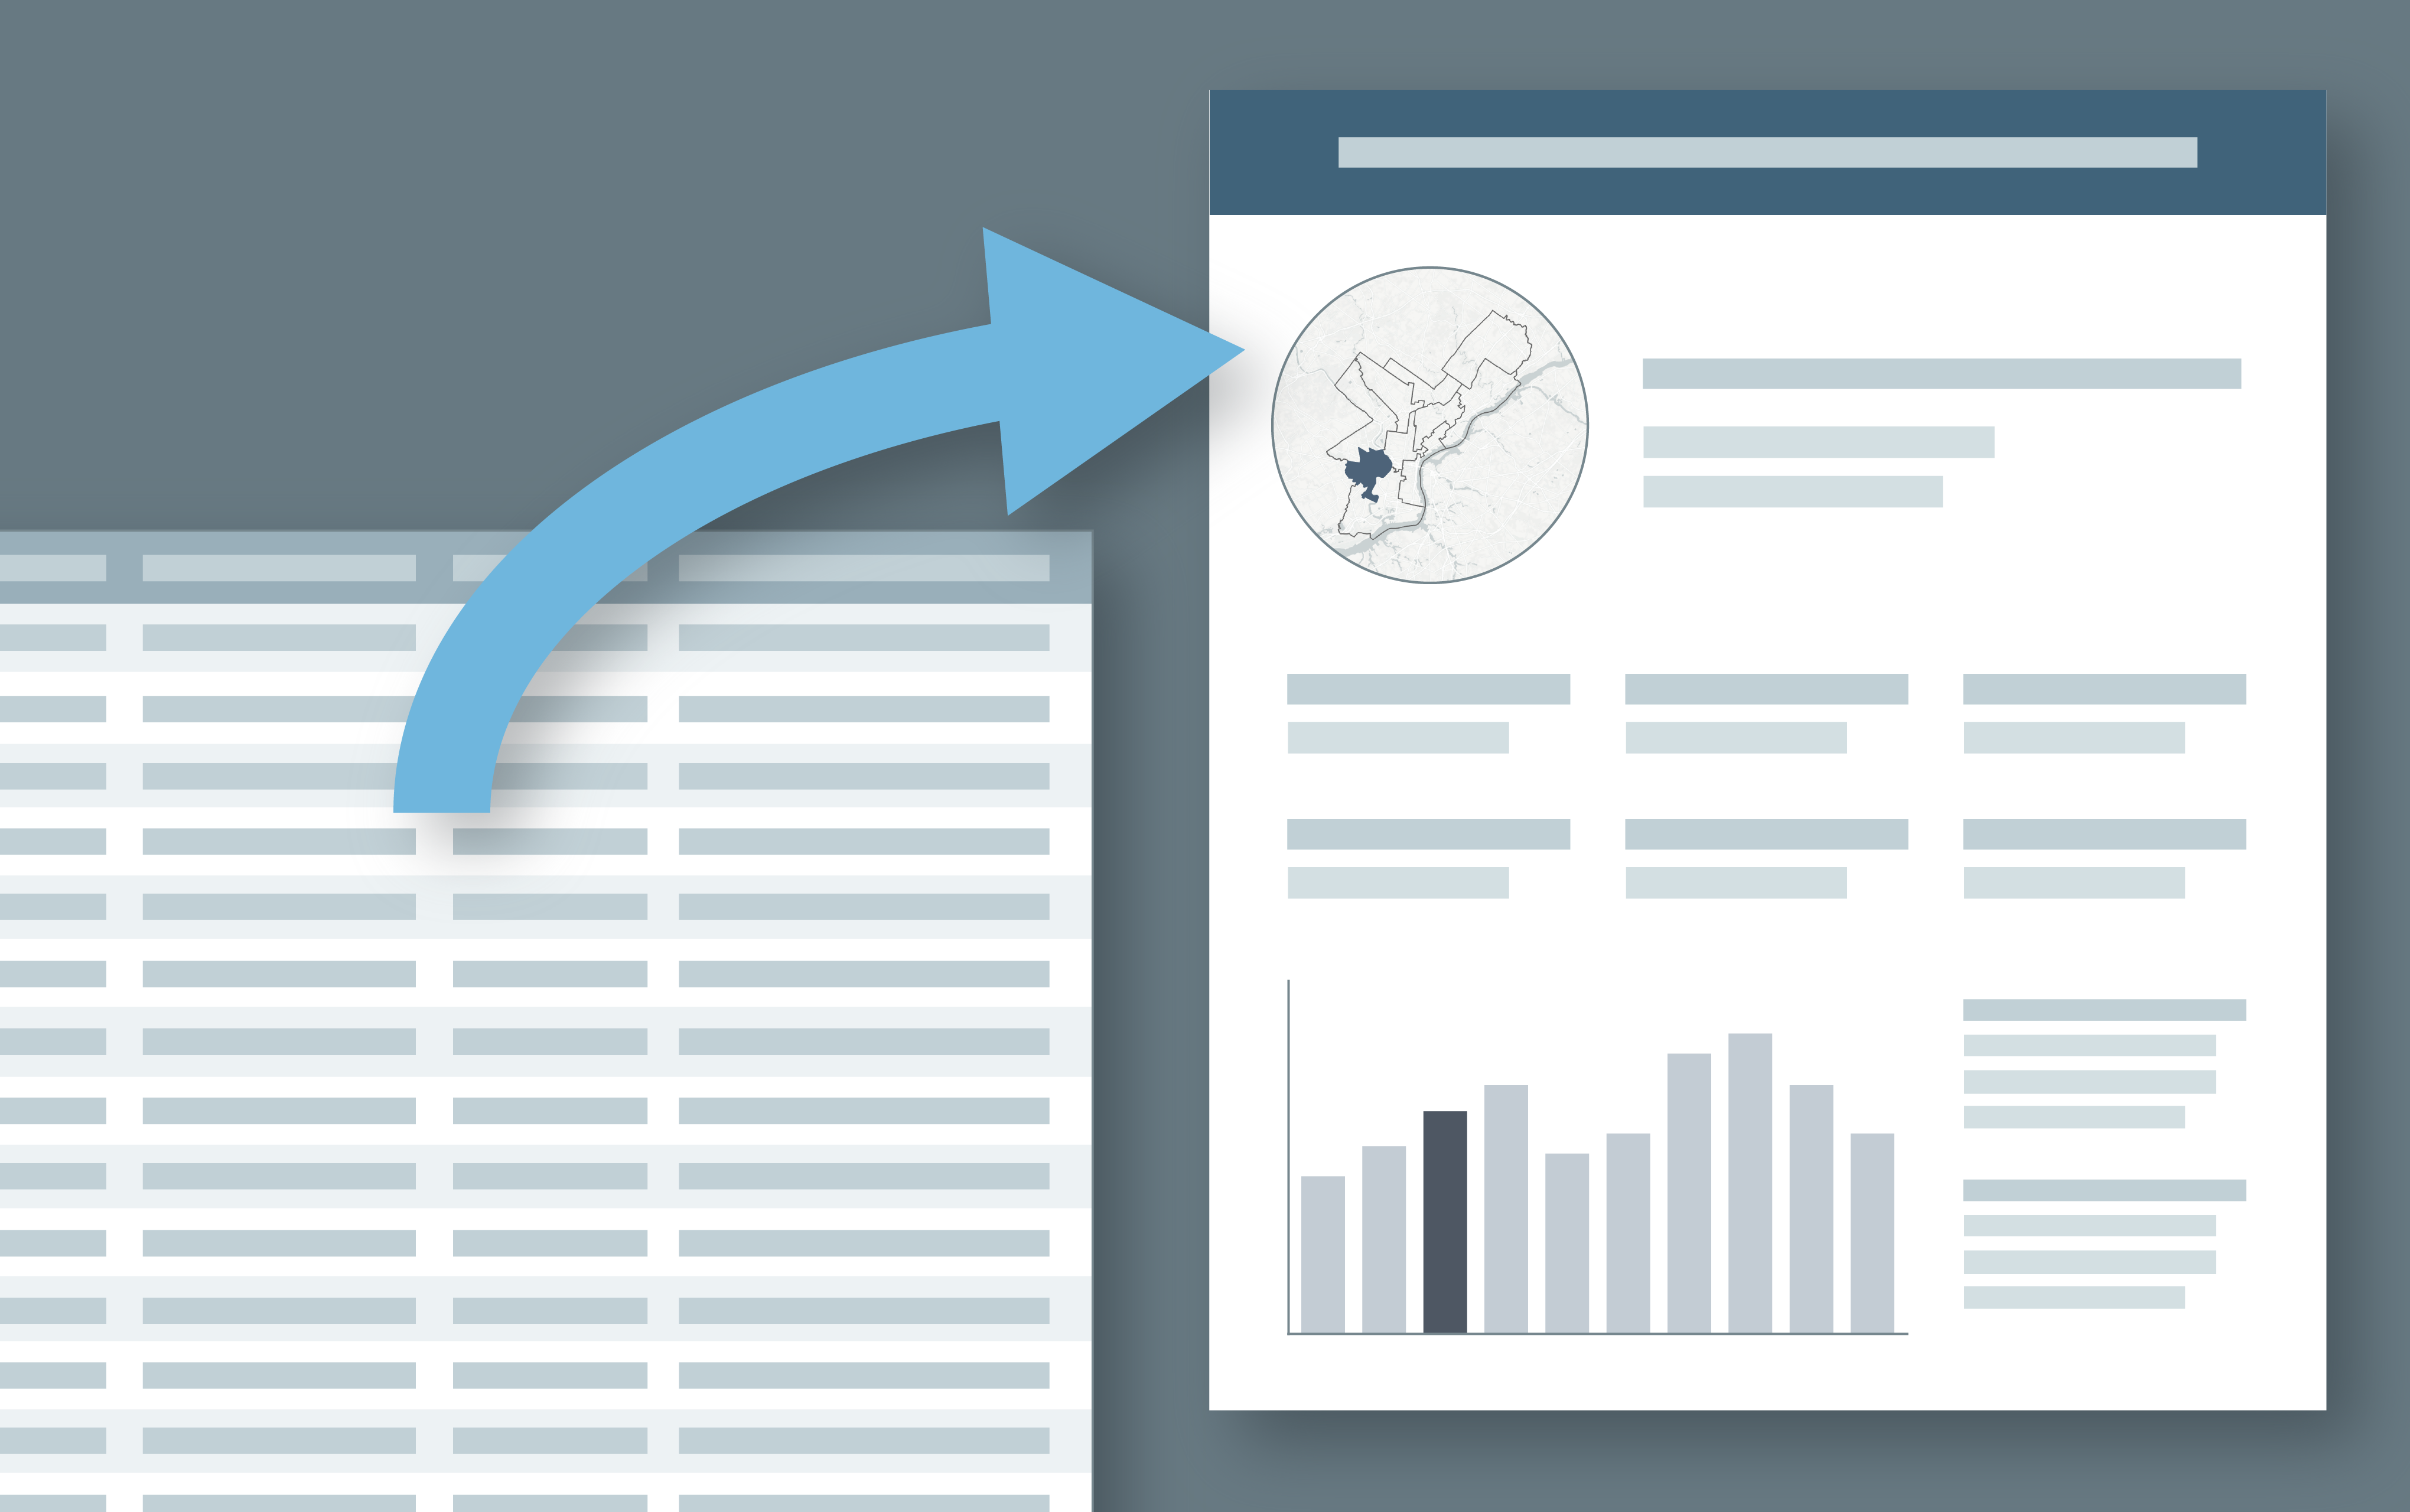
Using ArcMap, R, and Adobe Illustrator to Create Data Driven Infographics
Learn to create a series of data-driven infographics in the context of a project that evaluates bus performance in each Philadelphia City Council District.
-
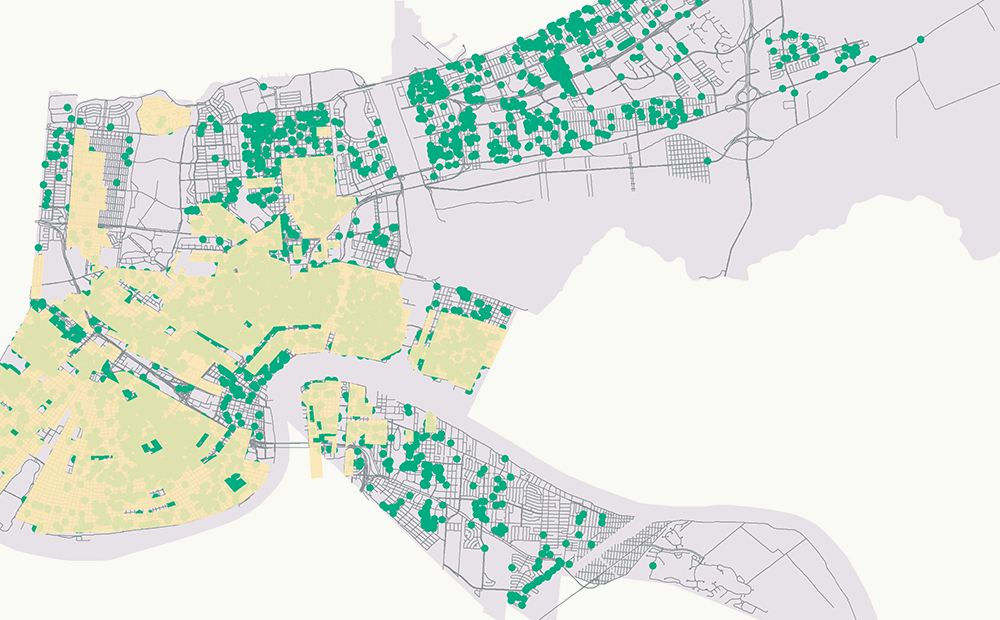
How Evictions Correspond to Past Divestment in New Orleans
We worked with Jane Place Neighborhood Sustainability Initiative as part of the 2018 Summer of Maps program to analyze evictions data in New Orleans.
-
Digitizing Maps Using Remote Sensing Techniques in ArcMap and R
Learn how to use image processing and remote sensing techniques in R and ArcGIS to digitize spatial data from image or PDF files.
-
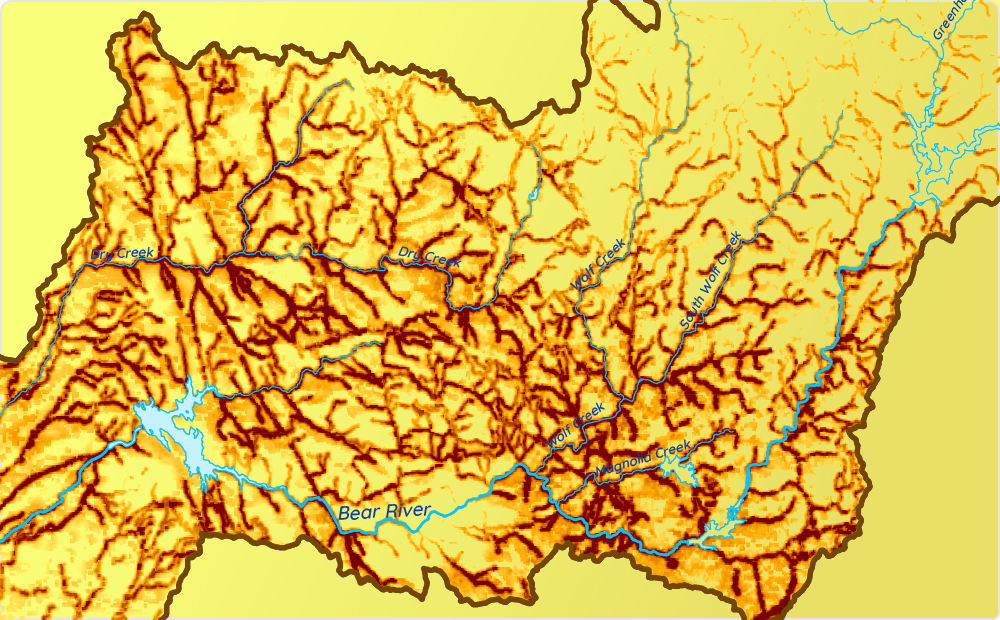
Creating Leaflet Tiles from Open Data using PostGIS and QGIS
A guide to transforming open geospatial data into slippy map tiles to display in Leaflet or OpenLayers using PostGIS, QGIS, and QTiles.
-
Engineer Onboarding with Breakable Toy
My experience joining the Operations Team at Azavea. This was the first time my colleagues used the Breakable Toy apprenticeship pattern.

-
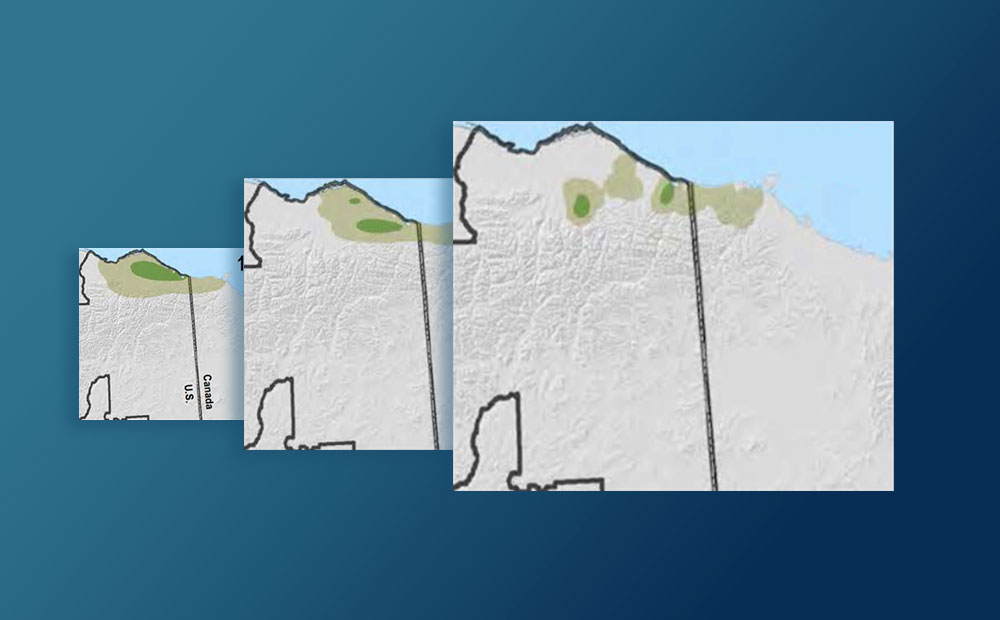
Preparing Data for MaxEnt Species Distribution Modeling Using R
How to use R to turn disparate environmental data into clean, usable raster data that can be fed into a MaxEnt species distribution model.
-
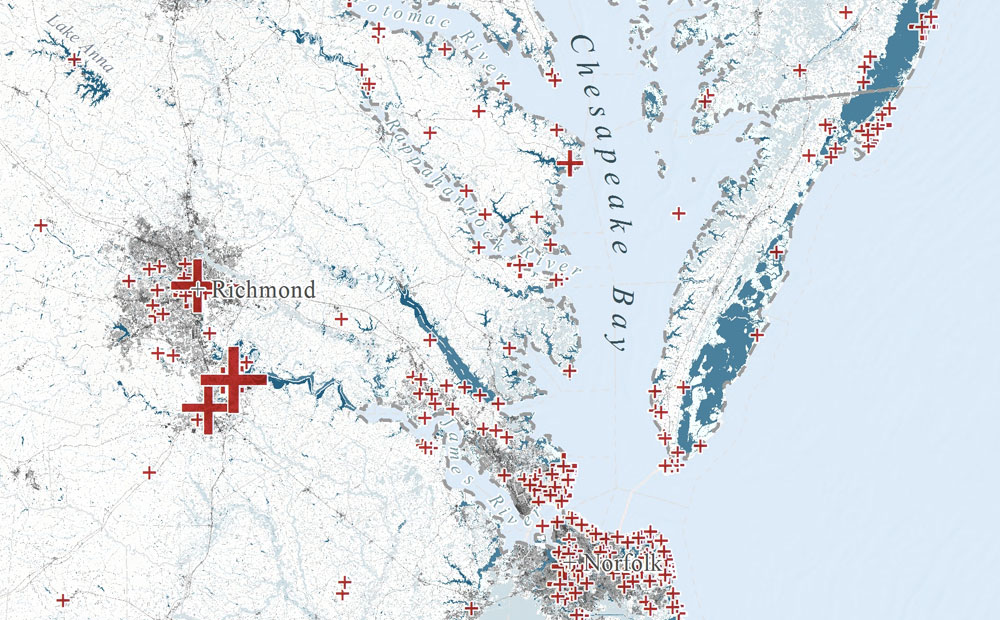
Evaluating Machine Learning Models in R: Predicting Marine Debris
Evaluating machine learning models in R with a focus on how to handle biased and imperfect data, specifically volunteer collected marine debris data.