Open Source
<- Return to all blogs
-
Introducing GeoPySpark, a Python Binding of GeoTrellis
GeoTrellis is a Scala library for working with geospatial data in a distributed environment. While powerful, it has a limited user base due to the geospatial community’s preference for other languages such as Python and R. Bringing GeoTrellis to another language has thus been a requested feature of the community. Well, after nine months of…
-
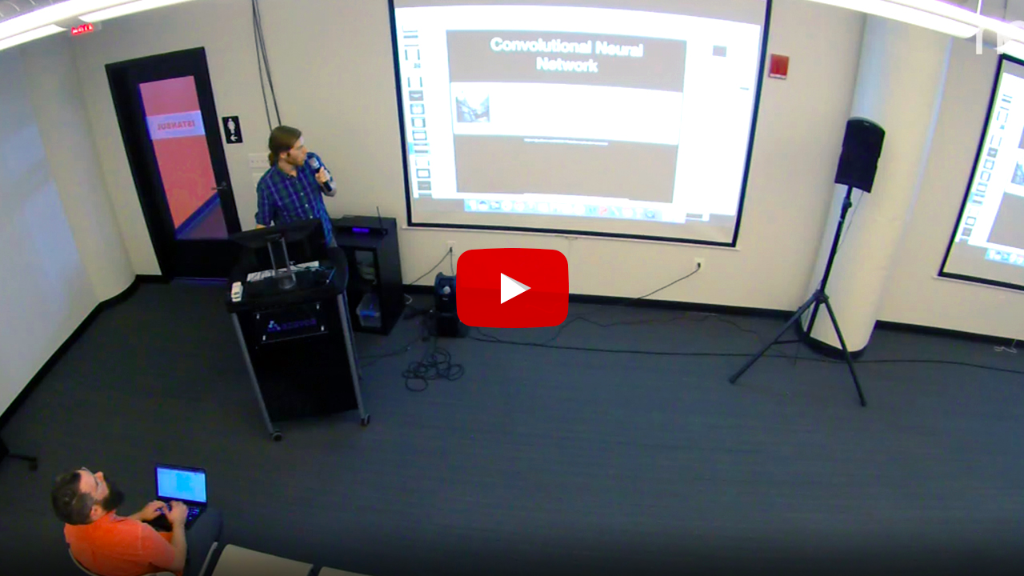
Video: Using Convolutional Neural Networks to Automatically Analyze Aerial and Satellite Imagery
In this recording of our most recent Technical Staff Meeting, we walk through our team’s work on Raster Vision, a set of open source tools for automatically analyzing aerial and satellite imagery using convolutional neural networks. As part of Raster Vision, we have implemented approaches to tagging (predicts a set of tags for each image)…
-
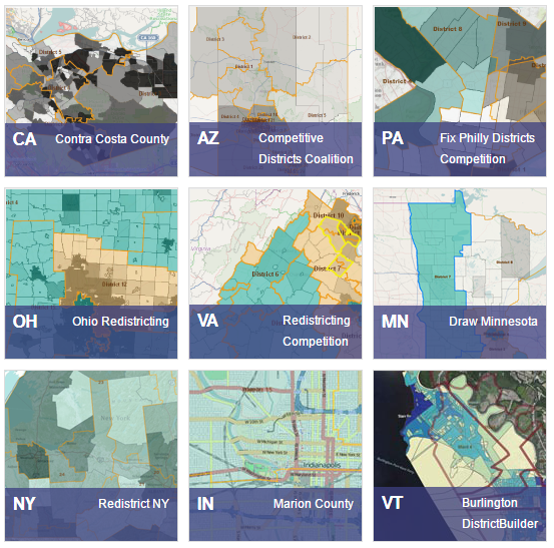
The Road Ahead for DistrictBuilder and Public Redistricting
Seven years ago Azavea began working with the Public Mapping Project to create DistrictBuilder, an open source, web software tool that would enable people to draw their own legislative district plans. We worked with leading redistricting experts: Michael McDonald (Associate Professor at the University of Florida and head of the Elections Project) and Micah Altman…
-
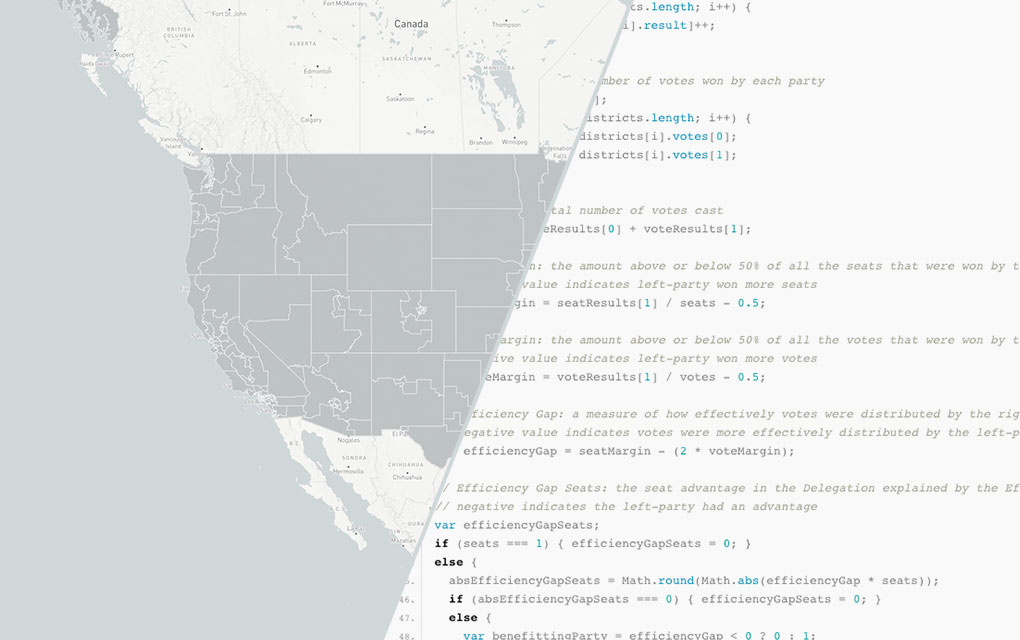
Leveraging Node.js, D3.js, and HTML Canvas for Scalable Infographics
In Part 3 of our 3-part series on Azavea’s redistricting and gerrymandering work, we look at the technical process behind developing infographics for efficiency gap reports. We made strategic use of JavaScript visual tools and Node.js as a scripting language in our design and production of 50 infographics about the efficiency gap, automatically creating one for…
-
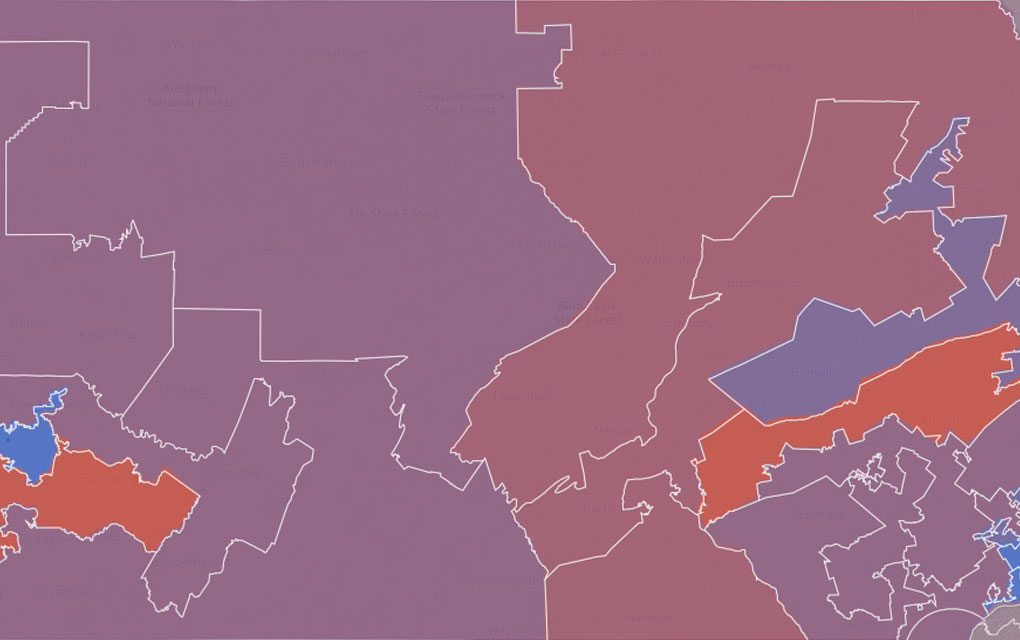
The Evolution of Our Redistricting and Gerrymandering Work
In part 1 of our series on Azavea’s redistricting and gerrymandering work, we look at the history of our involvement in this space and what we’re currently working on. Gerrymandering, compactness, contiguity, the efficiency gap. These are the kinds of words that make a lot of redistricting nerds excited these days. Rarely does the application…
-
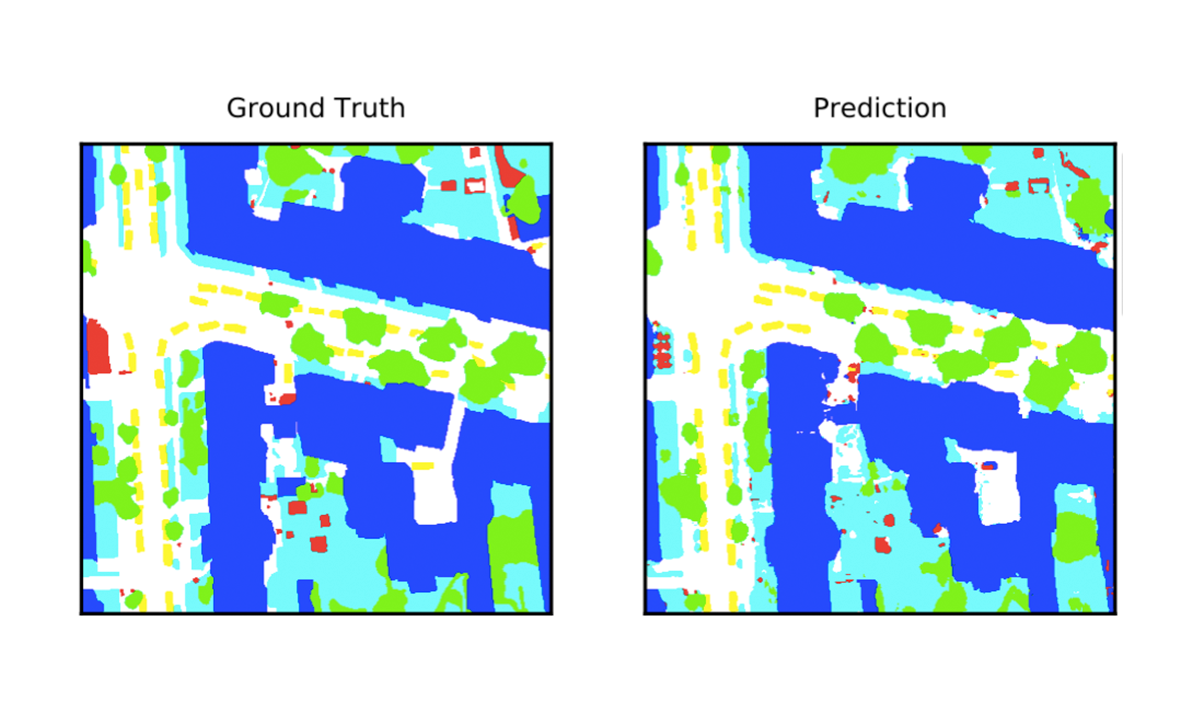
Deep Learning for Semantic Segmentation of Aerial and Satellite Imagery
This post describes how to use deep learning to do semantic segmentation on aerial and satellite imagery, experiments on the ISPRS Potsdam dataset, and how to visualize model predictions on a map.
-
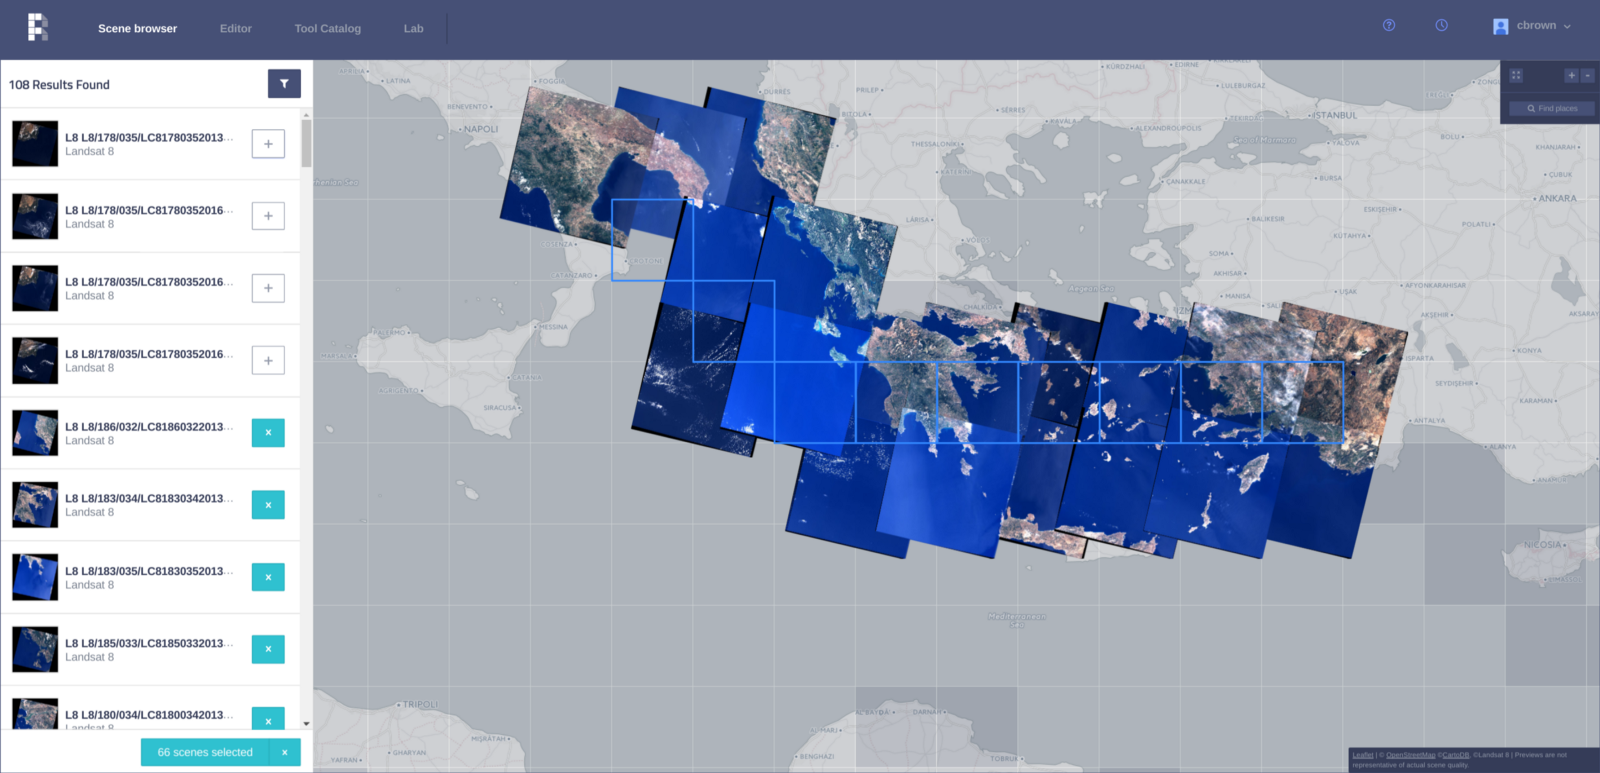
Raster Foundry: Geospatial Analysis at AnyВ Scale
Azavea has a rich history of productizing our research: from forecasting crime to managing green infrastructure in cities to aggregating elected official data. One of the primary reasons that I love working here is our ongoing commitment to supporting research that translates directly into civic and social impact (typically by making complex analytical tools approachable…
-
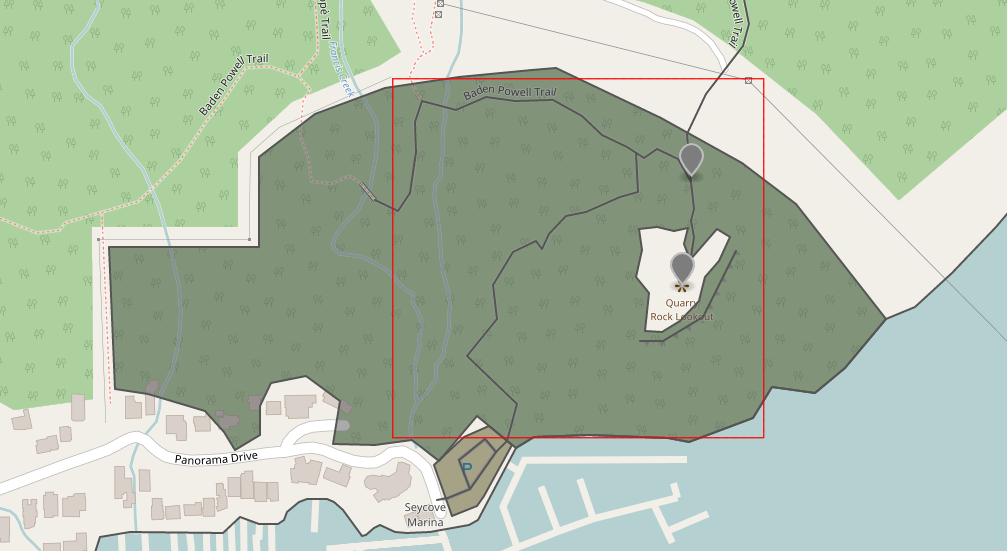
A World’s Worth of VectorTiles
This post outlines our general approach, our current status, and some of the roadbumps we’ve hit along the way while developing a free-and-open-source pipeline in Mapbox VectorTiles.
-
GeoDocker Development Workflow
In this post we discuss our experience using GeoDocker, a collection of Docker containers, to overcome challenges associated with developing, testing, and deploying data projects.
-
How to Manipulate Big Data for Use in ArcMap
How to use the open source program PGAdmin to prep large data sets for use in ArcMap.