Open Data
<- Return to all blogs
-
Creating Leaflet Tiles from Open Data using PostGIS and QGIS
A guide to transforming open geospatial data into slippy map tiles to display in Leaflet or OpenLayers using PostGIS, QGIS, and QTiles.
-
Creating Leaflet Tiles from Open Data using PostGIS and QGIS
A guide to transforming open geospatial data into slippy map tiles to display in Leaflet or OpenLayers using PostGIS, QGIS, and QTiles.
-
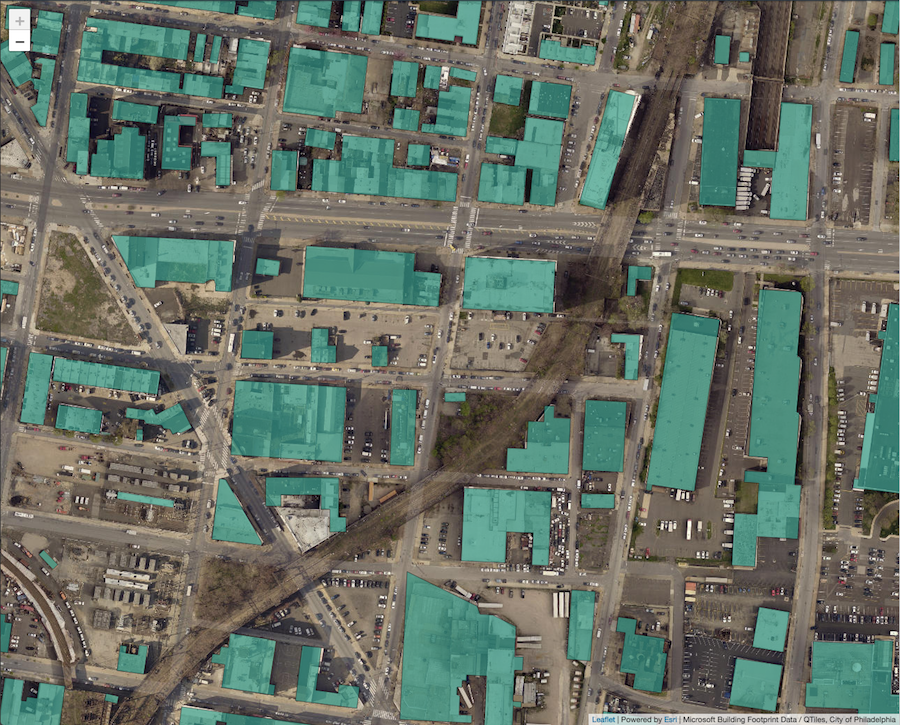
How to Convert Geodatabase Spatial Data and Related Tables to Vector Tiles
Use this open source data processing pipeline to convert geodatabase files to vector tiles for use in a web application.
-
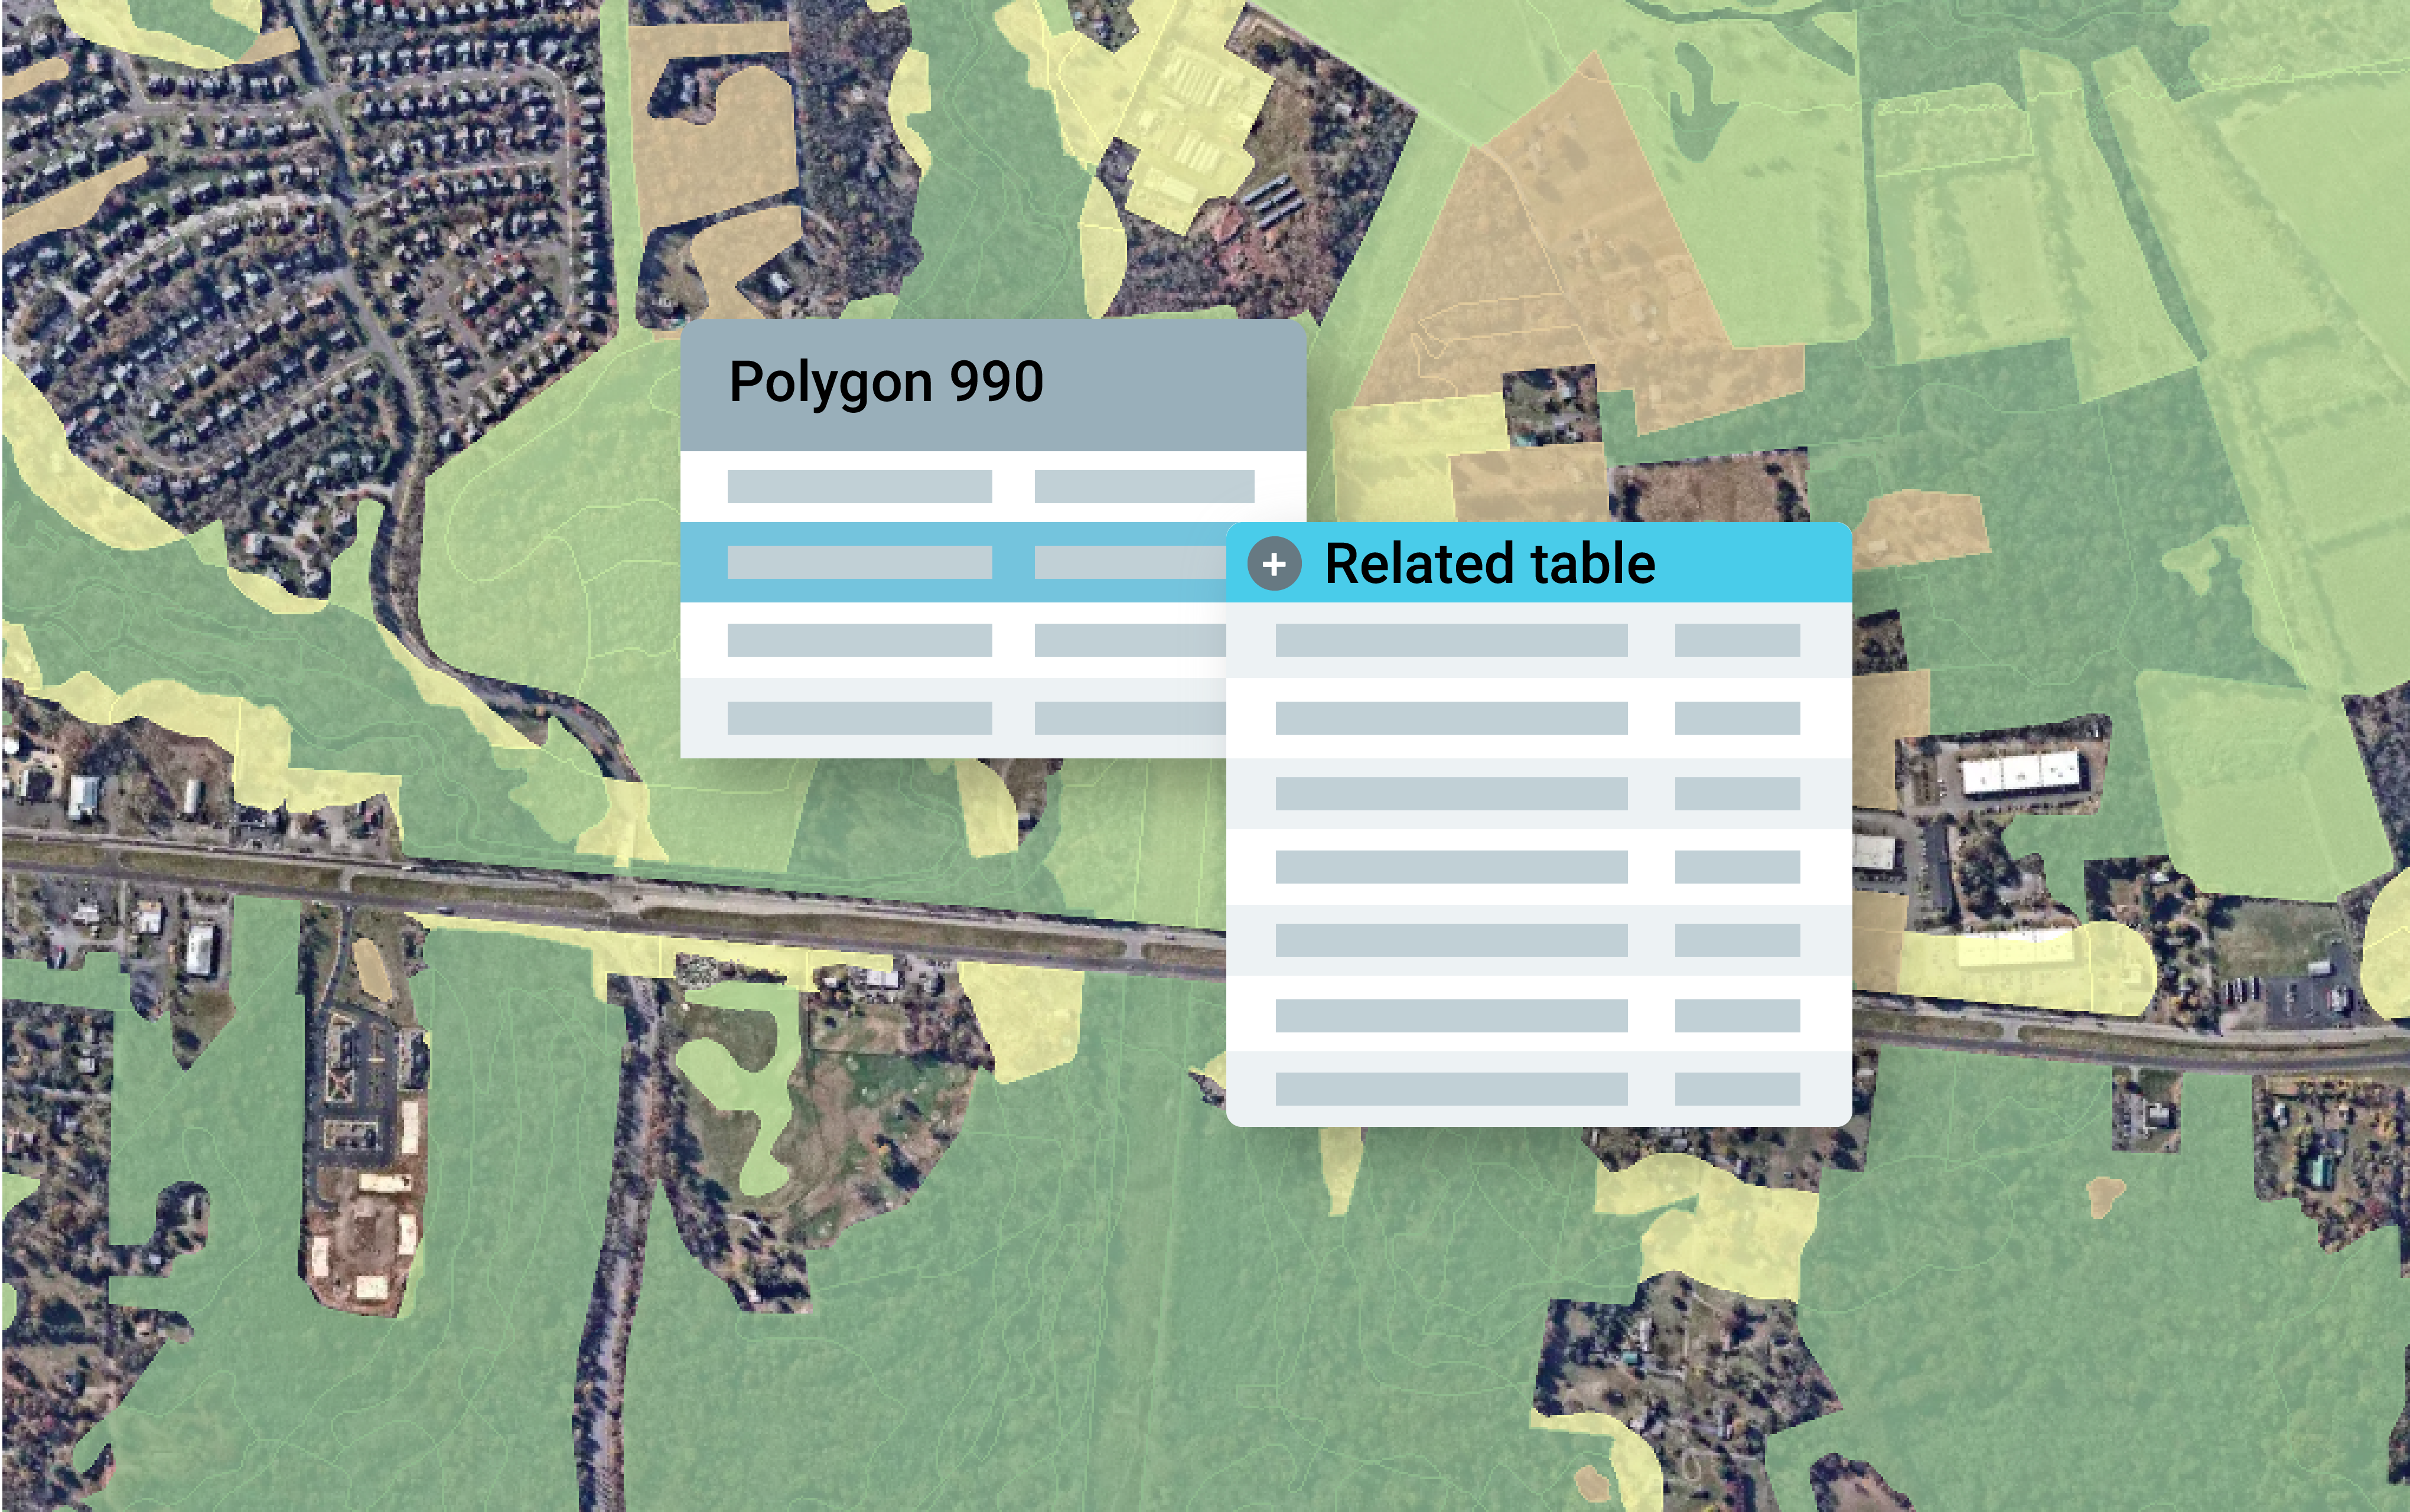
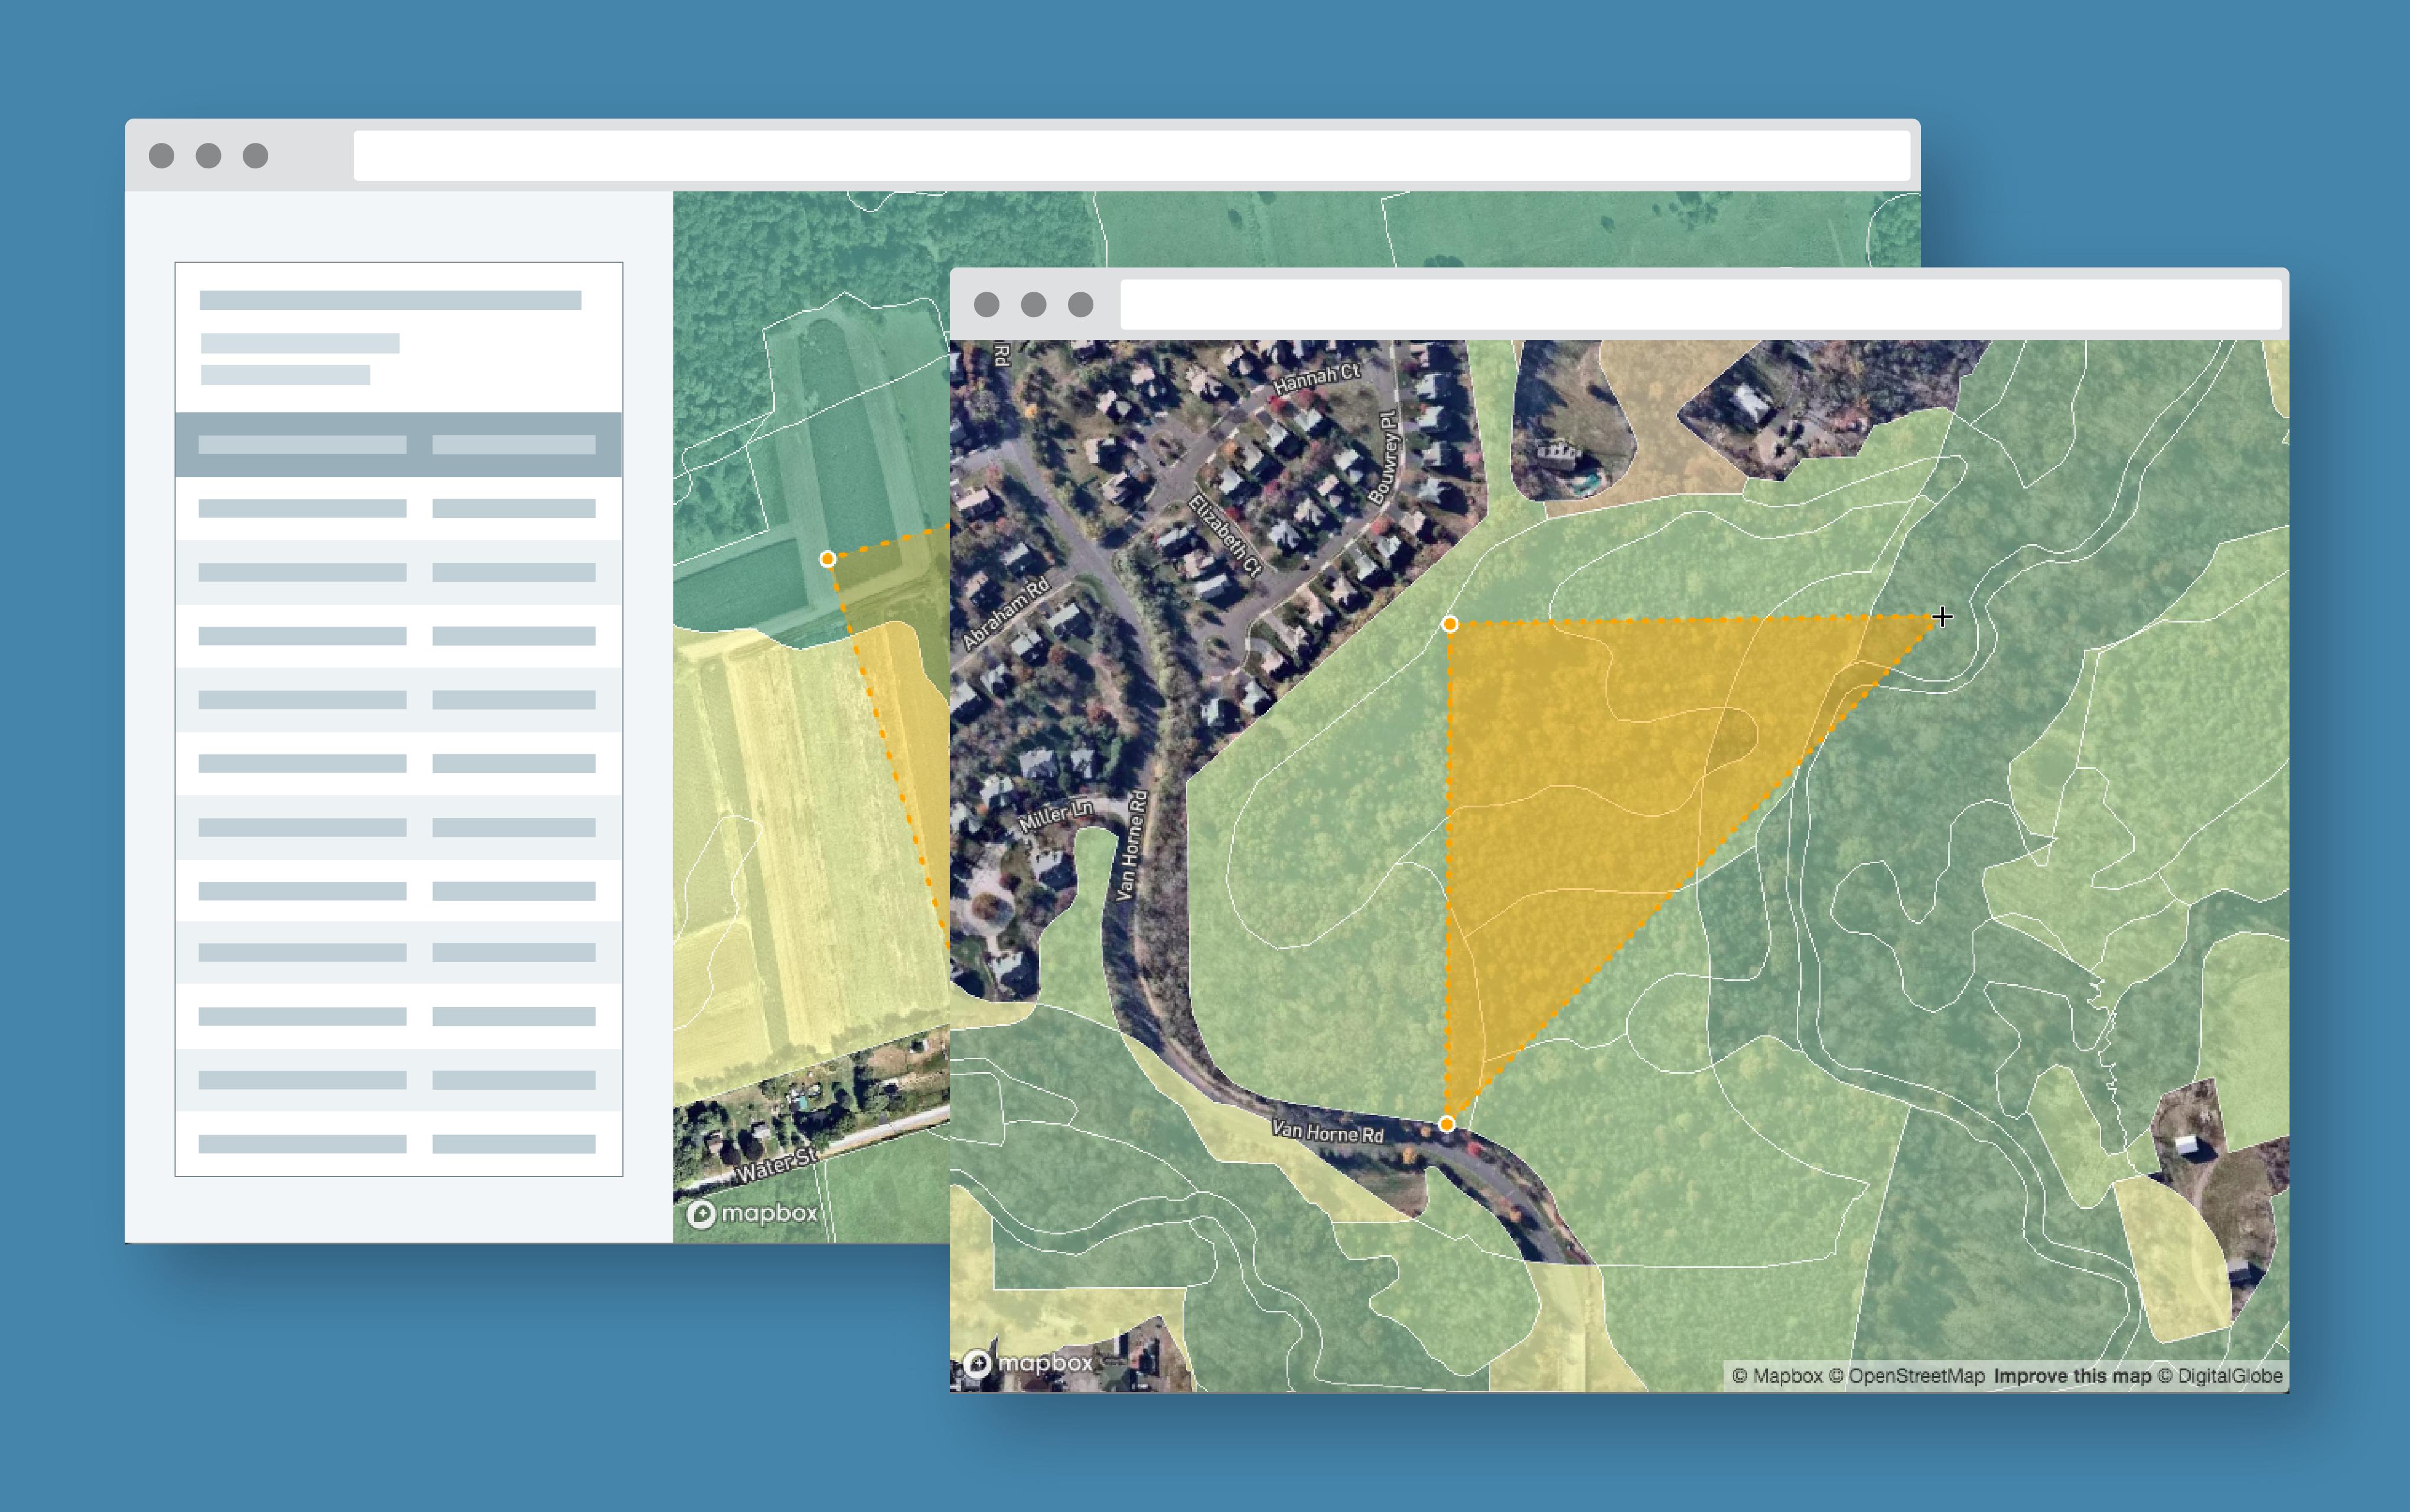
Exploring Protected Wildlife Habitat for Every Property in New Jersey
This Azavea 10% Time project defines a process for converting big data files to vector tiles and allows a user to identify habitat areas in need of protection.
-
Trajectory of Geospatial Open Source Innovation Discussed at FOSS4G NA
Earlier this month, we presented, exhibited, and attended talks at FOSS4G NA in St. Louis. Read our recap of events and view the slides from our presentations.

-
Open Civic Data Standards: Book of Adopted and Proposed Standards
The Open Civic Data Standards ebook outlines the status of open data standards in several civic domains and lists domains where there is strong potential for developing or defining new open data standards.
-
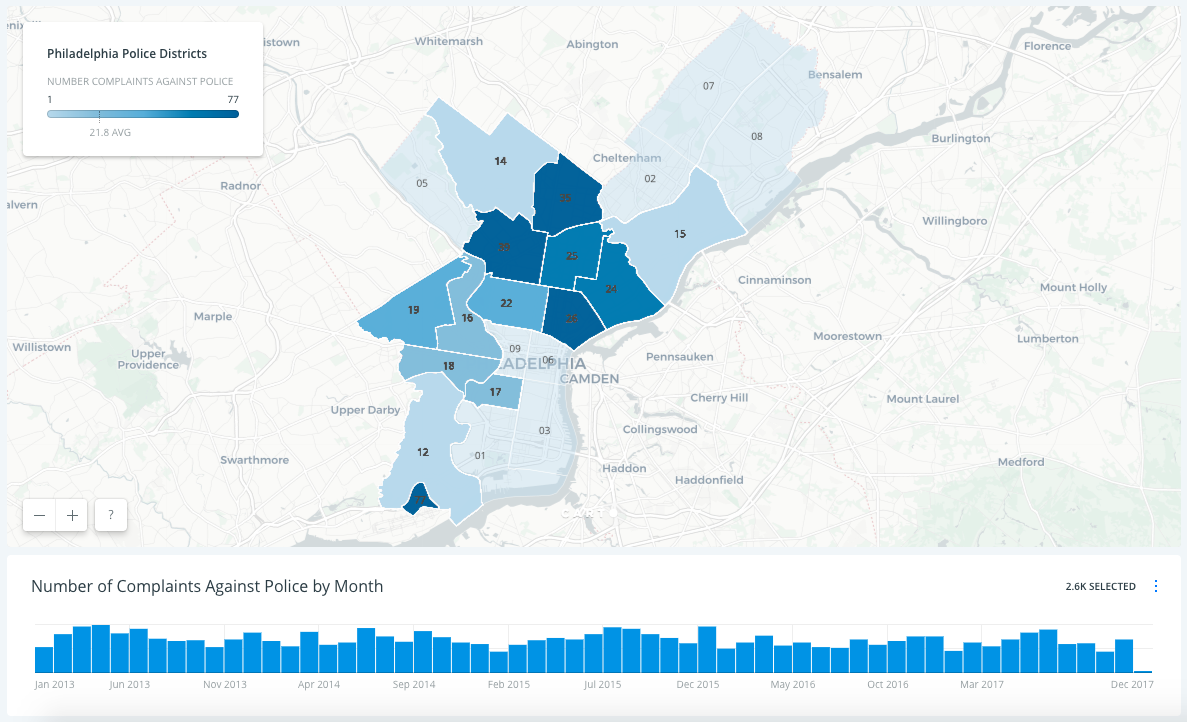
Map of Complaints Against Philadelphia Police from 2013 to 2017
This high level analysis joins newly released open data with Police Districts to create a map of Complaints Against Philadelphia Police from 2013 to 2017.
-
Predicting Land Use in the Amazon using Deep Learning
Learn about our methods and results leveraging our RasterVision deep learning project to predict land use in satellite images of the Amazon.

-
Climate Change Projections for Excessive Heat Days at Arizona Airports
We used GeoPySpark, Python binding for GeoTrellis, to analyze climate change data and determine Arizona airports at risk for excessive heat days.

-
#HOTLunch: Volunteer Your Lunch Break to Support Disaster Relief Efforts
Volunteer your lunch break for #HOTLunch to map features that NGOs use to plan aid efforts in response to natural disasters and humanitarian crises.
-
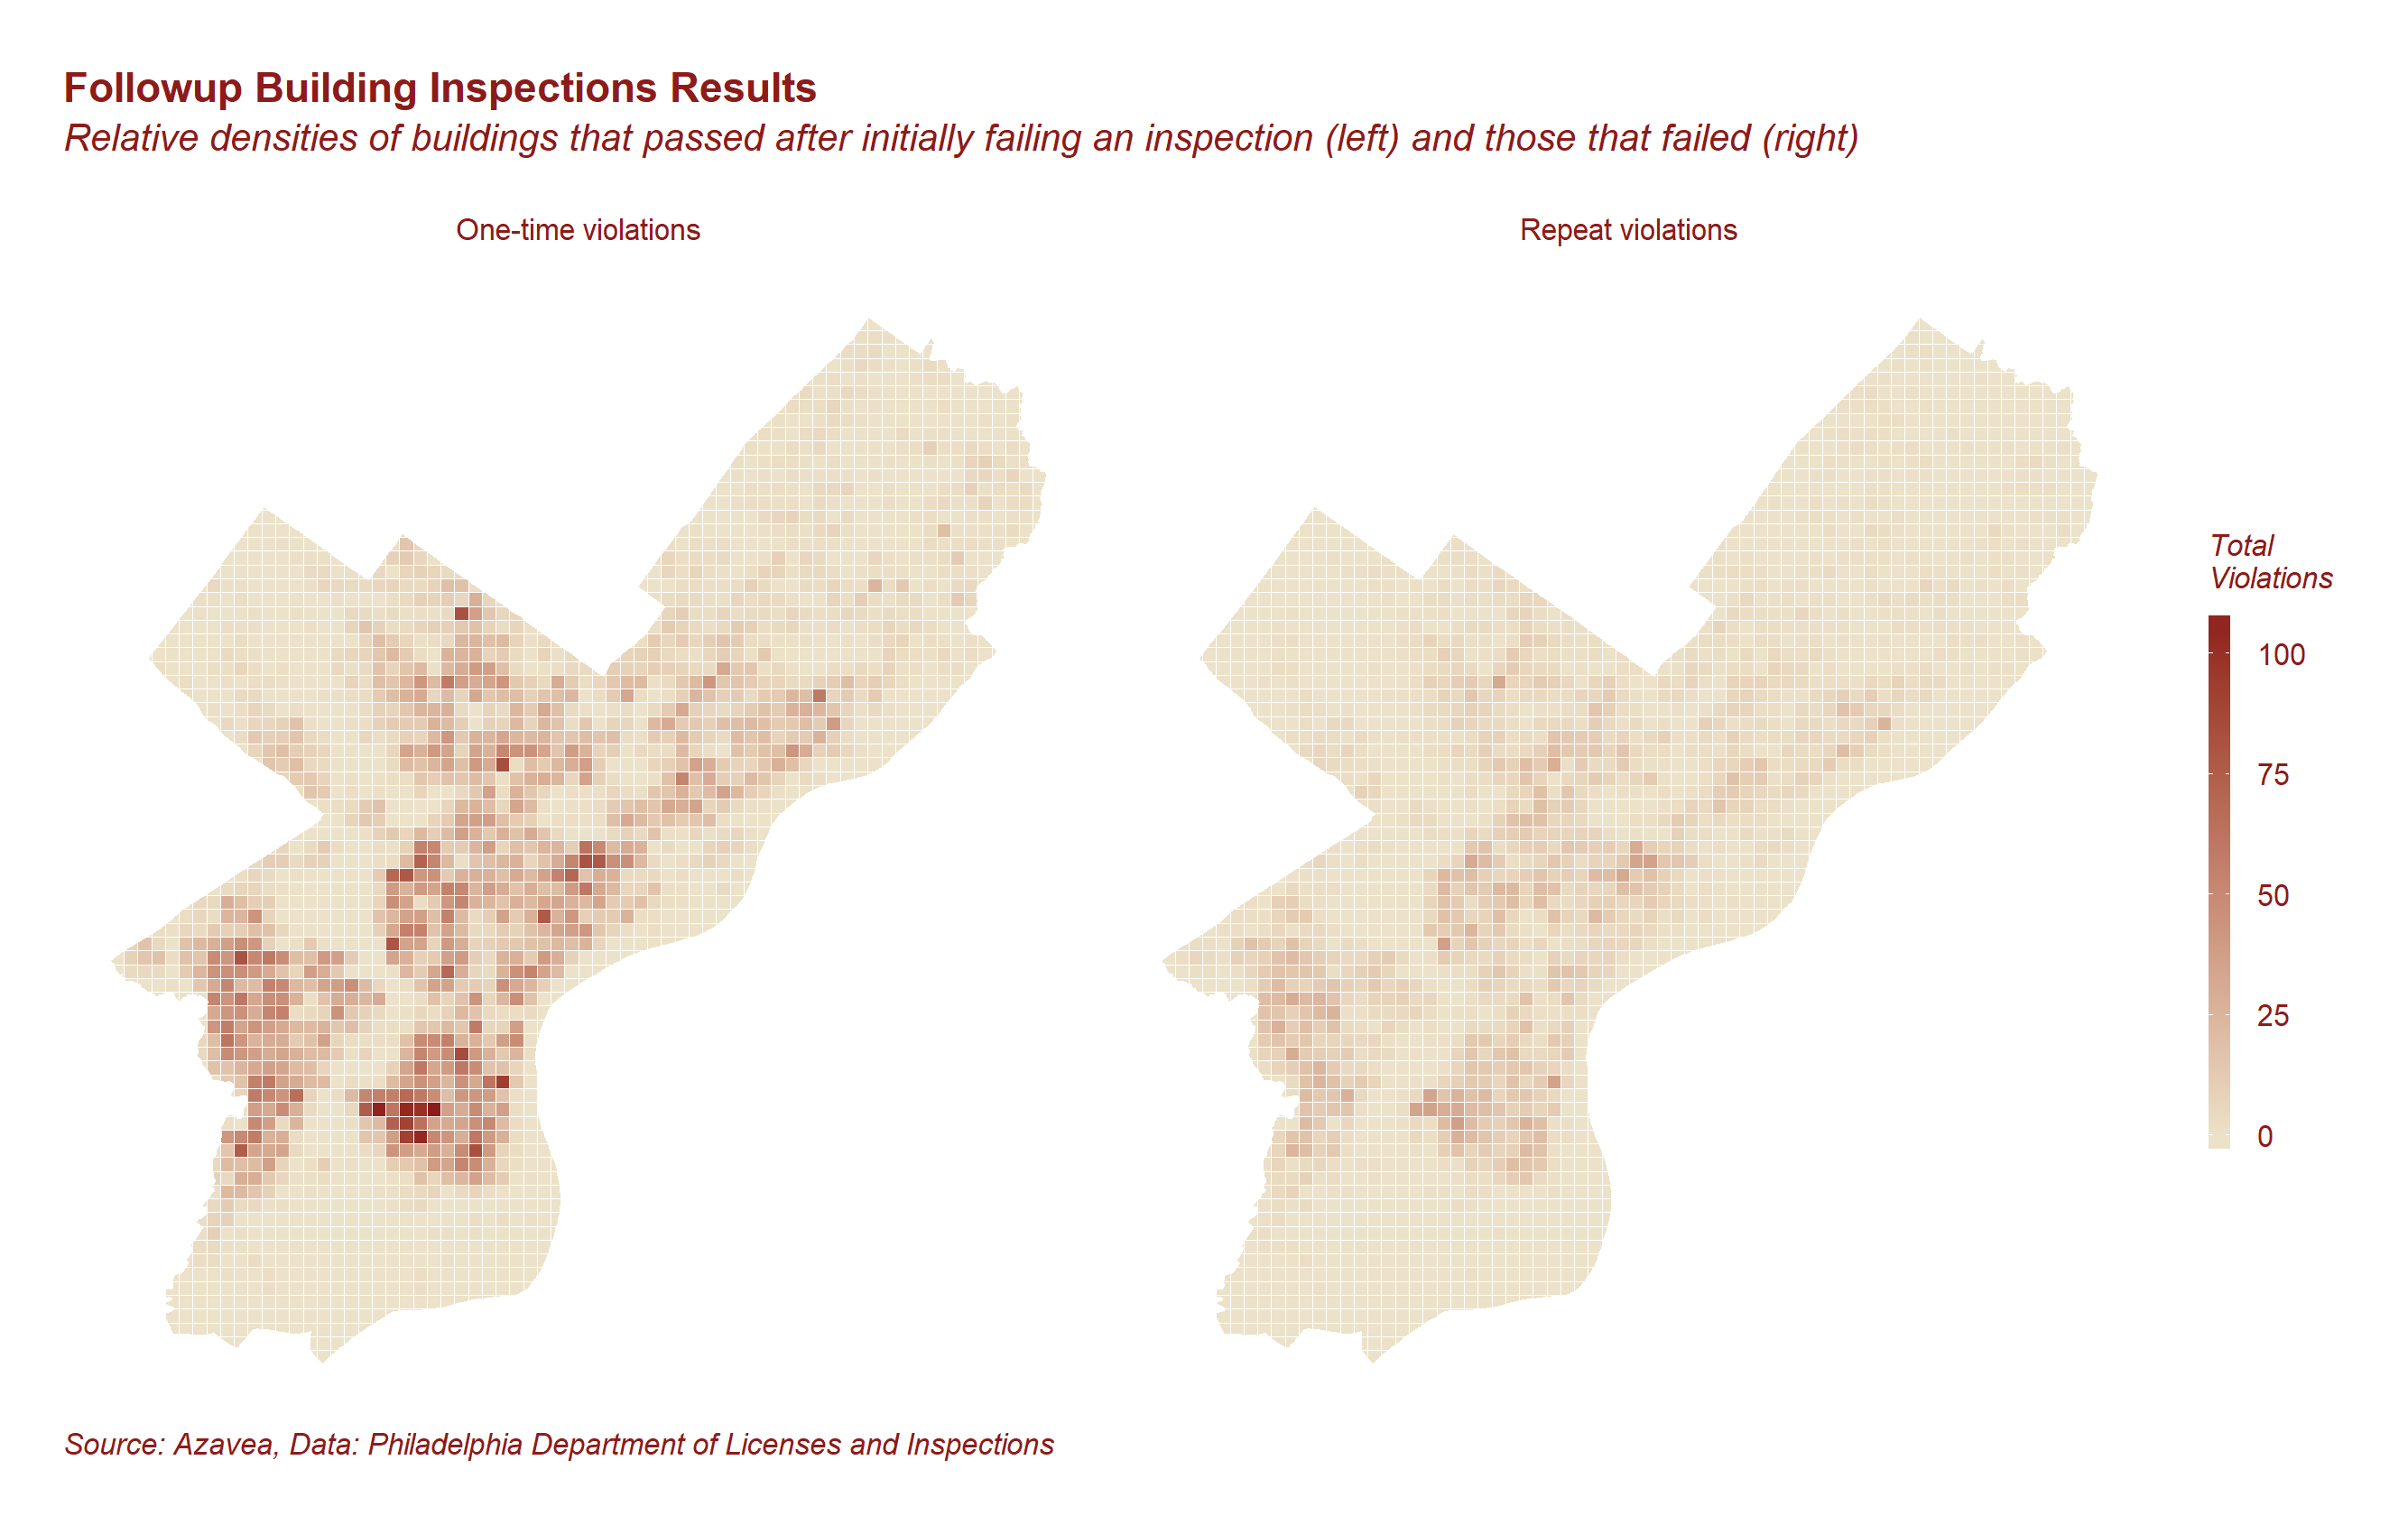
Predicting Building Code Compliance with Machine Learning Models
Which buildings should inspectors prioritize? We used machine learning models to predict building code compliance and address resource allocation questions.