Community
<- Return to all blogs
-

Six Ways we Fund Innovation
Without outside funding and given our commitment to openly sharing our knowledge, people often ask: How do you fund your innovation? We outline 6 main ways.
-
Six Ways we Fund Innovation
Without outside funding and given our commitment to openly sharing our knowledge, people often ask: How do you fund your innovation? We outline 6 main ways.
-
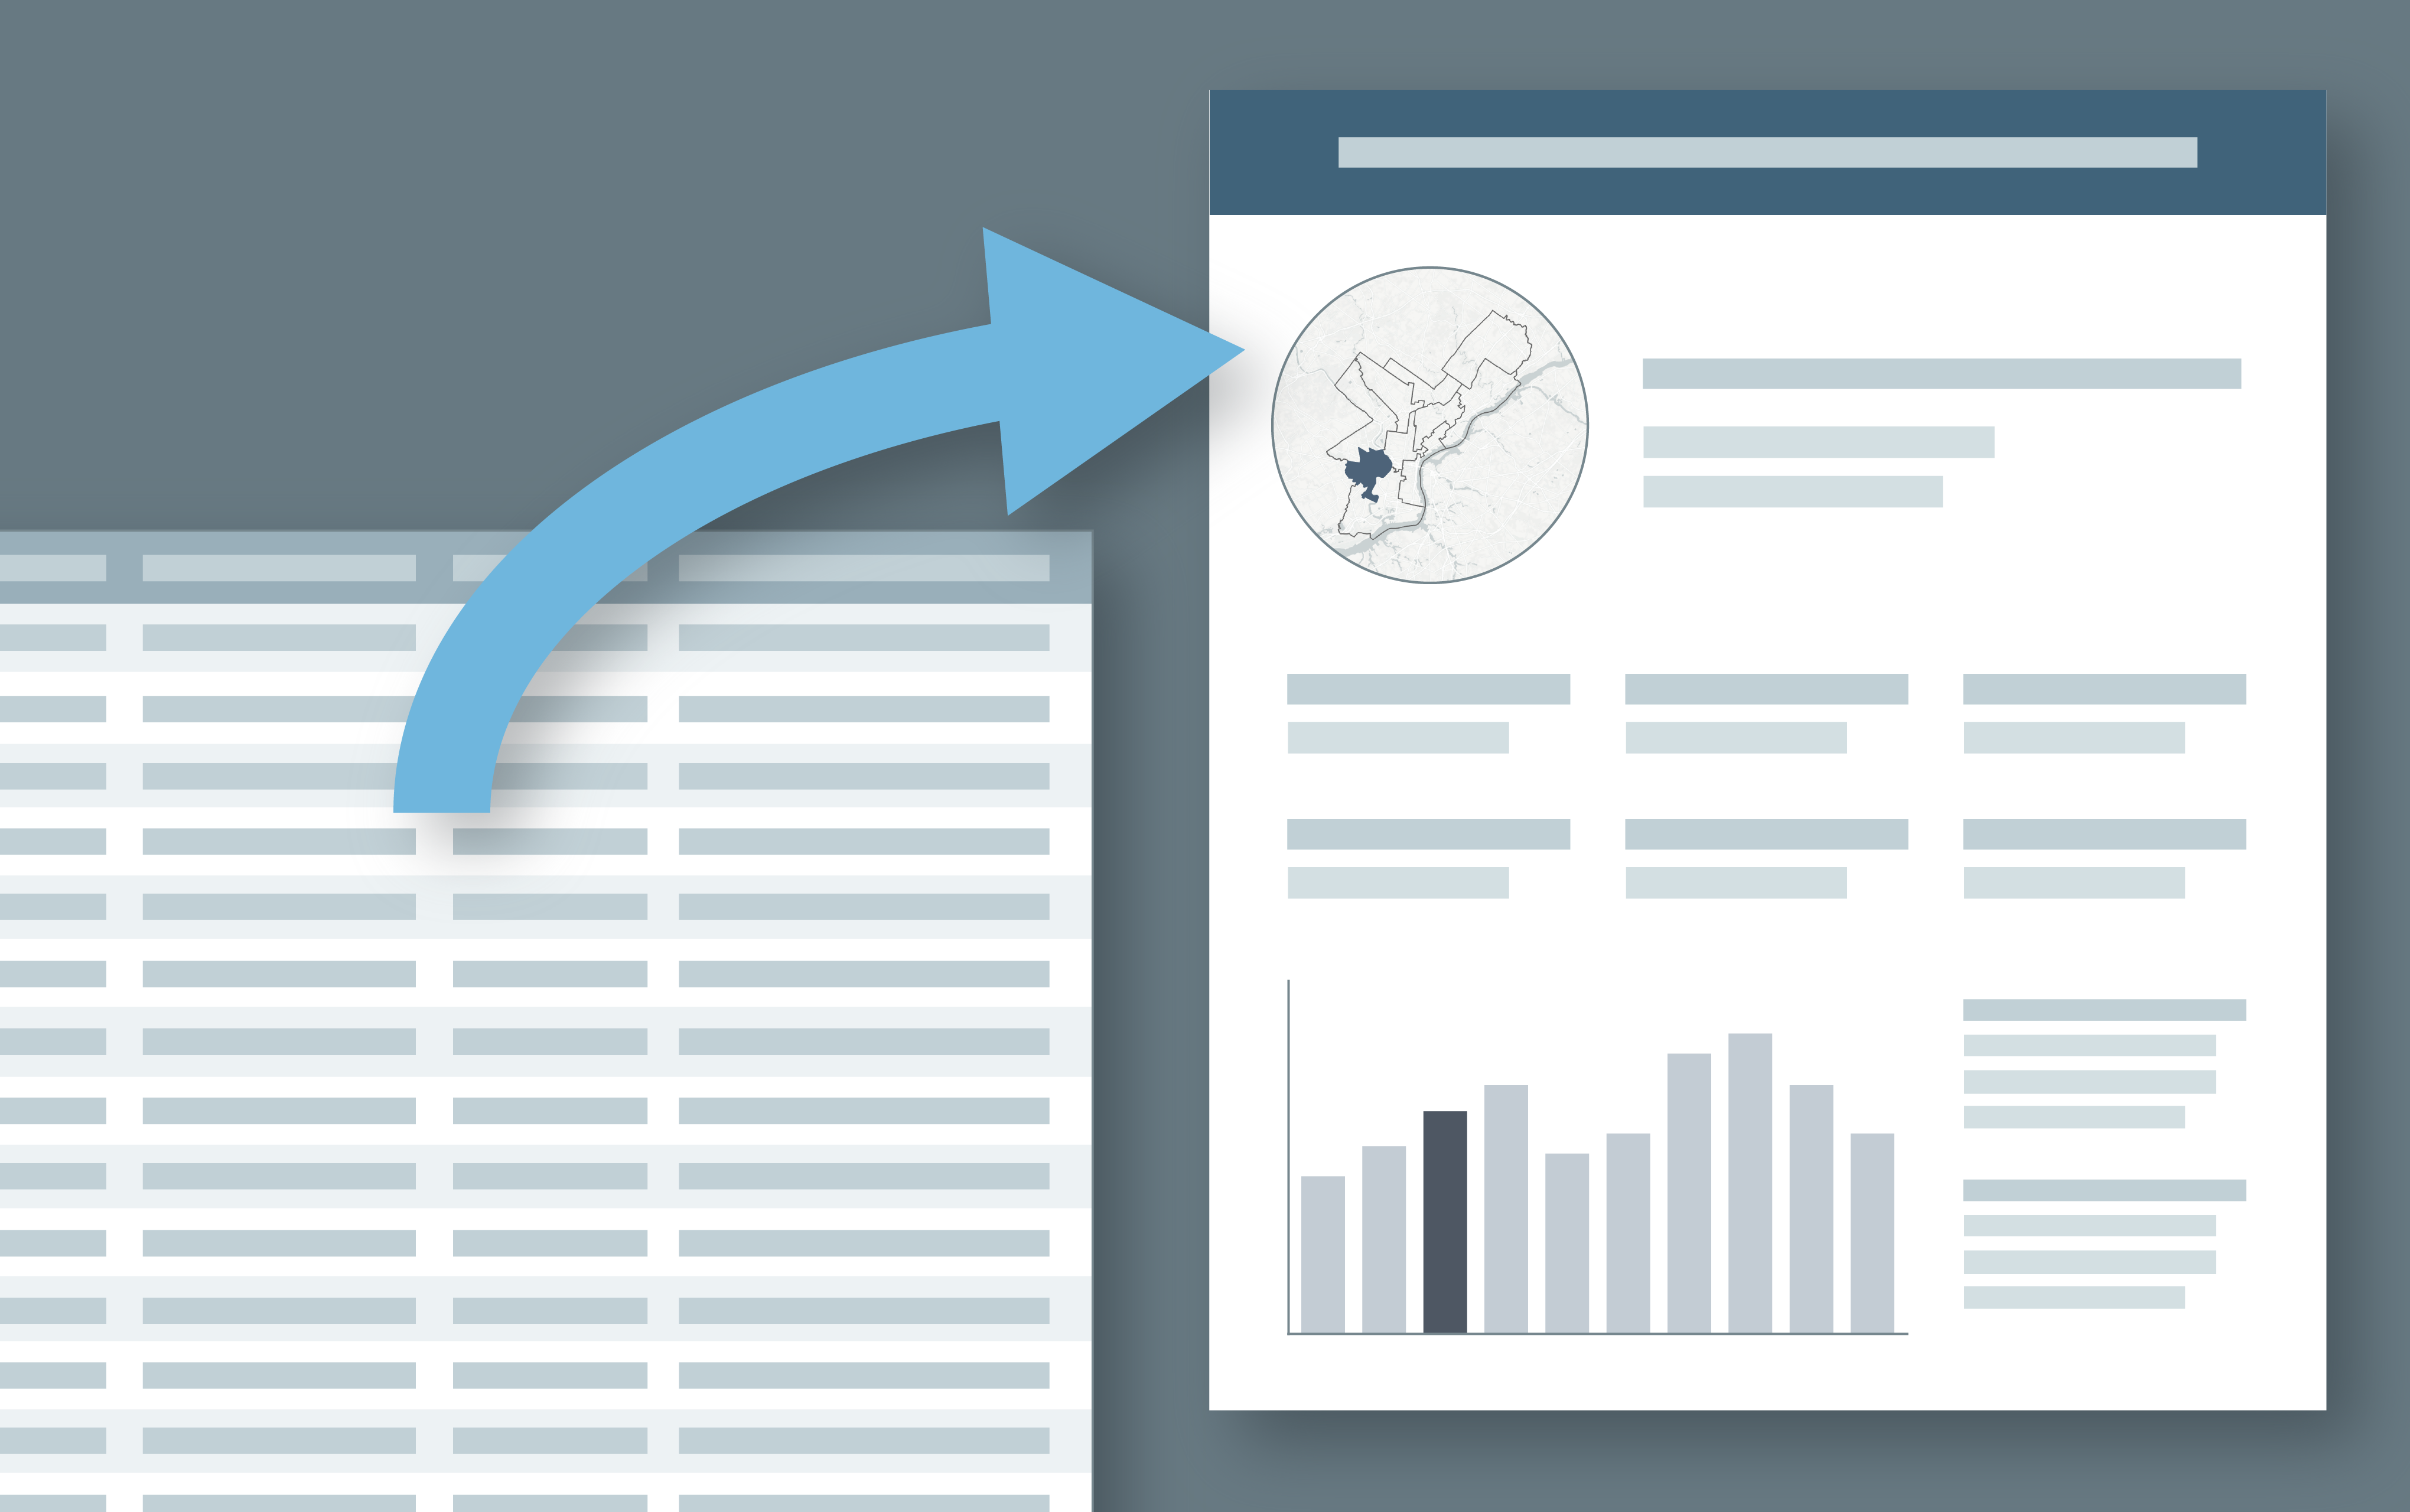
Using ArcMap, R, and Adobe Illustrator to Create Data Driven Infographics
Learn to create a series of data-driven infographics in the context of a project that evaluates bus performance in each Philadelphia City Council District.
-
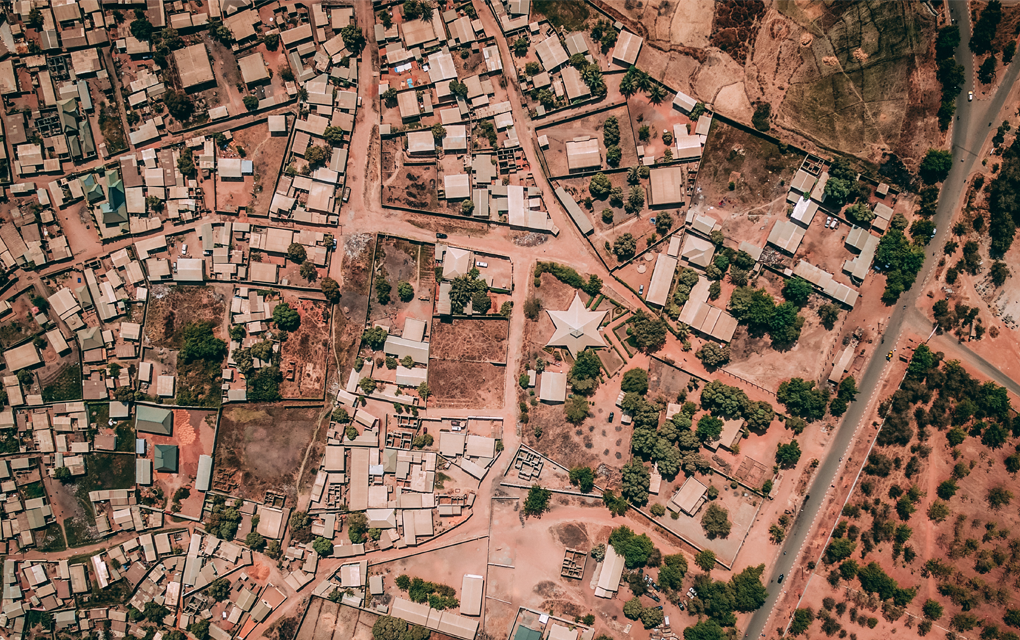
Three (Earth) Observations from Sat Summit 2018
Here are our key takeaways from SatSummit and some thoughts to help drive innovation related to earth observation data toward impactful solutions.
-
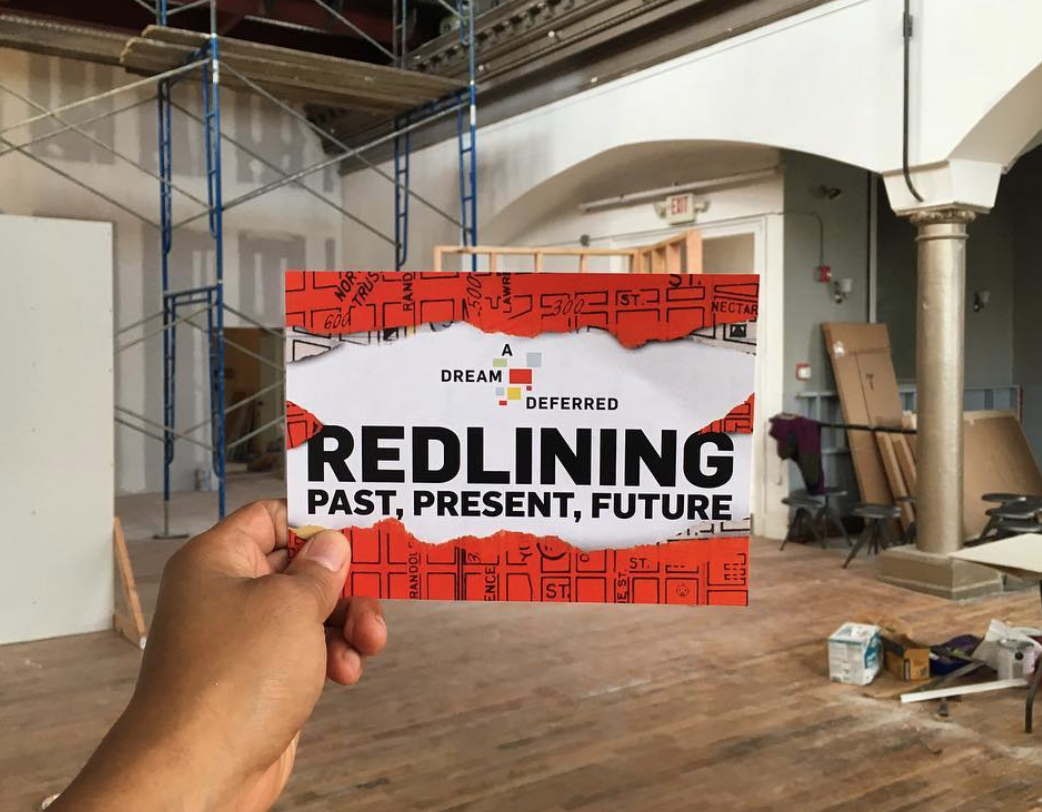
Public Redlining Exhibit Showcases Azavea’s Data Analysis Work
In September 2018, a free exhibit opened to the public on the history of redlining in Philadelphia. Read about how our Data Analytics team was involved.
-
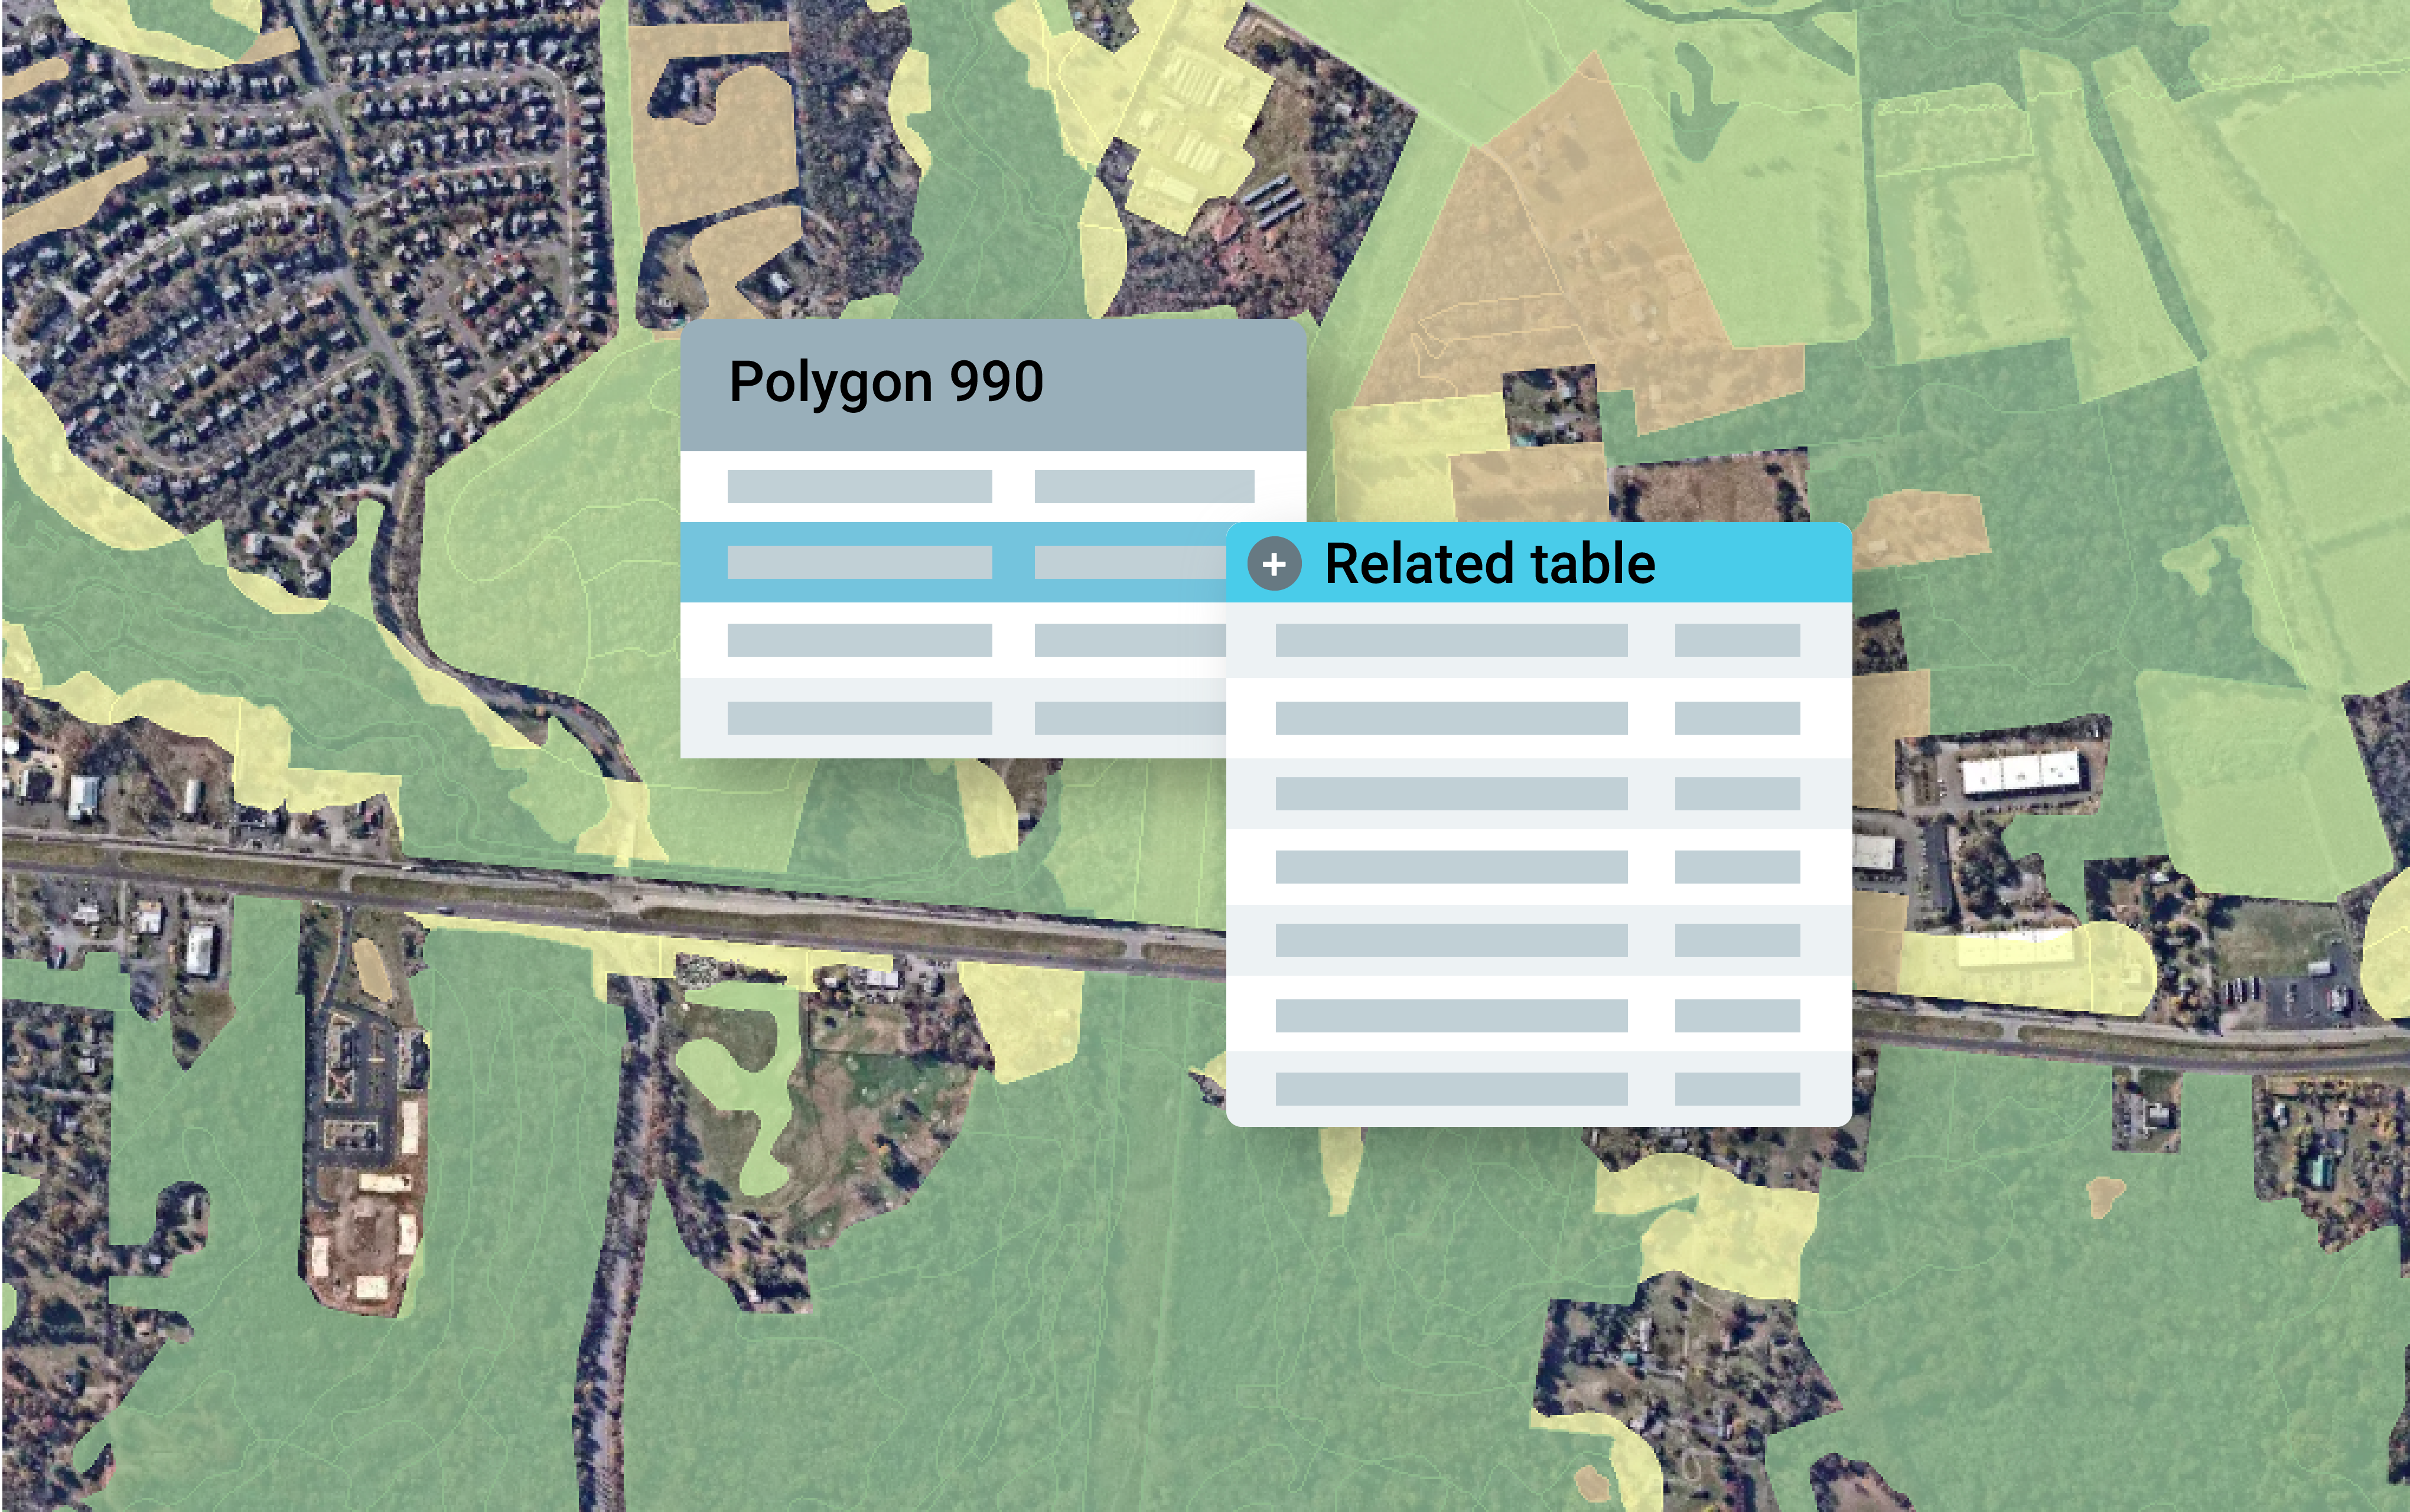
How to Convert Geodatabase Spatial Data and Related Tables to Vector Tiles
Use this open source data processing pipeline to convert geodatabase files to vector tiles for use in a web application.
-
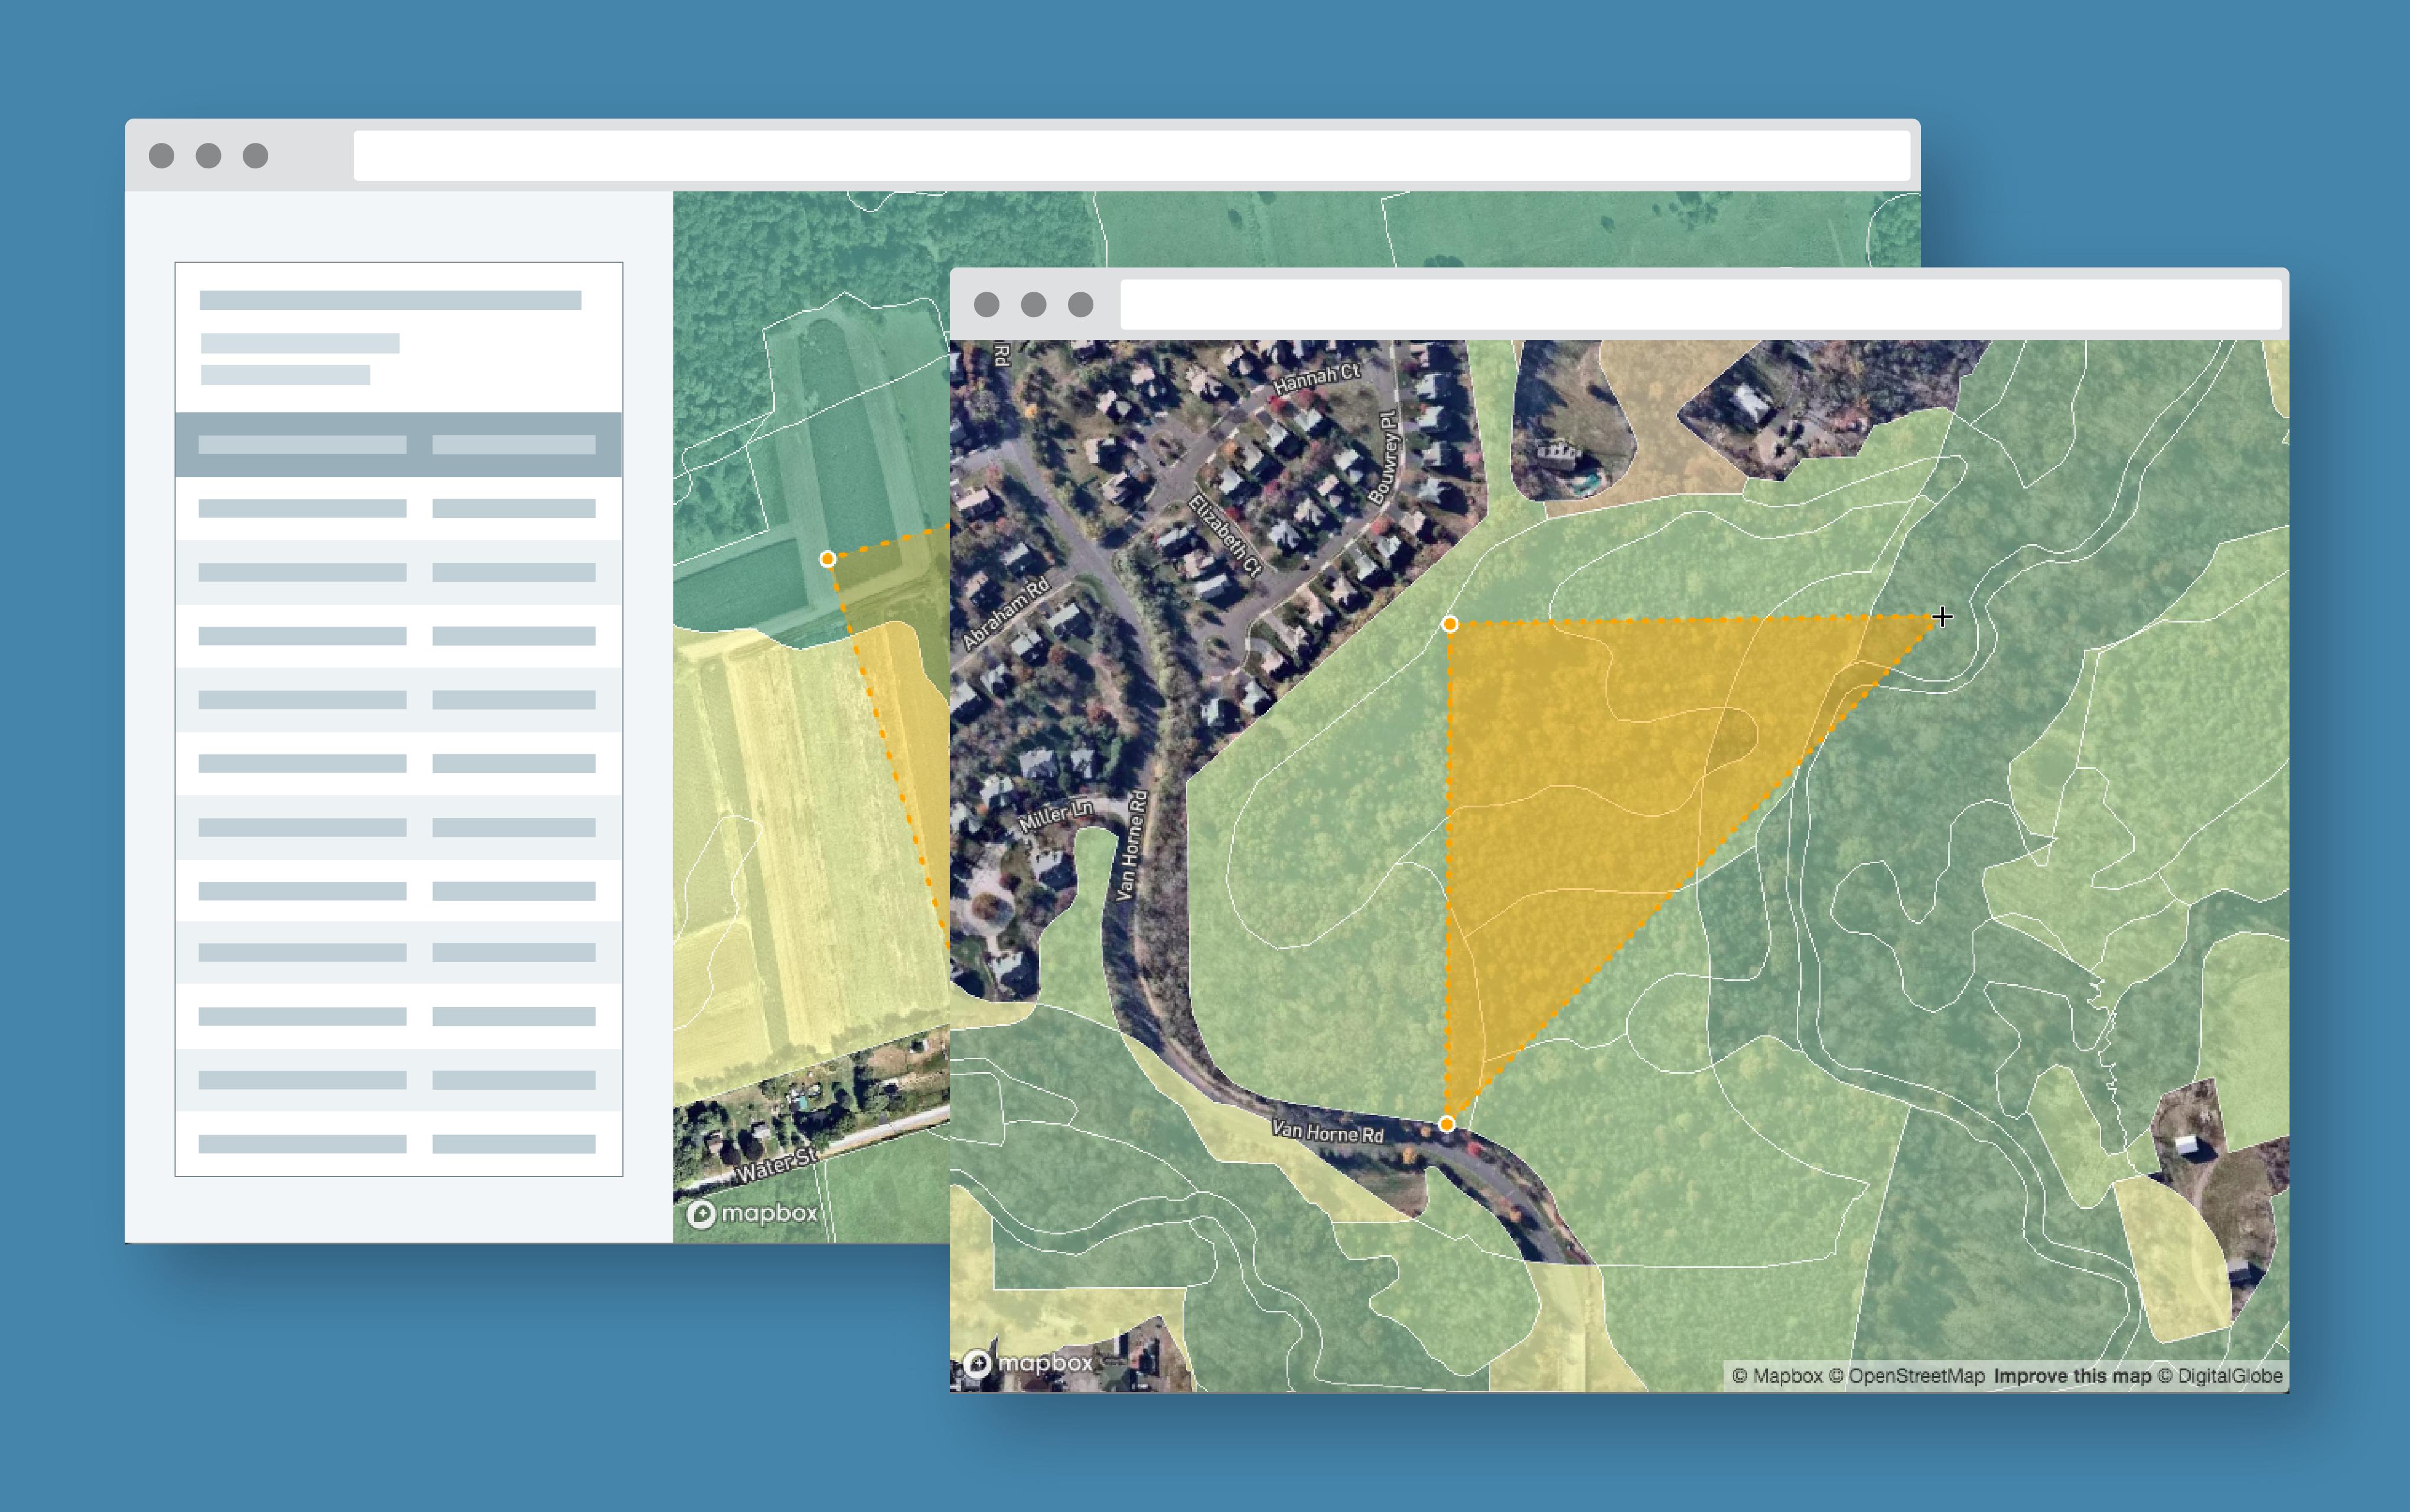
Exploring Protected Wildlife Habitat for Every Property in New Jersey
This Azavea 10% Time project defines a process for converting big data files to vector tiles and allows a user to identify habitat areas in need of protection.
-
Trajectory of Geospatial Open Source Innovation Discussed at FOSS4G NA
Earlier this month, we presented, exhibited, and attended talks at FOSS4G NA in St. Louis. Read our recap of events and view the slides from our presentations.

-
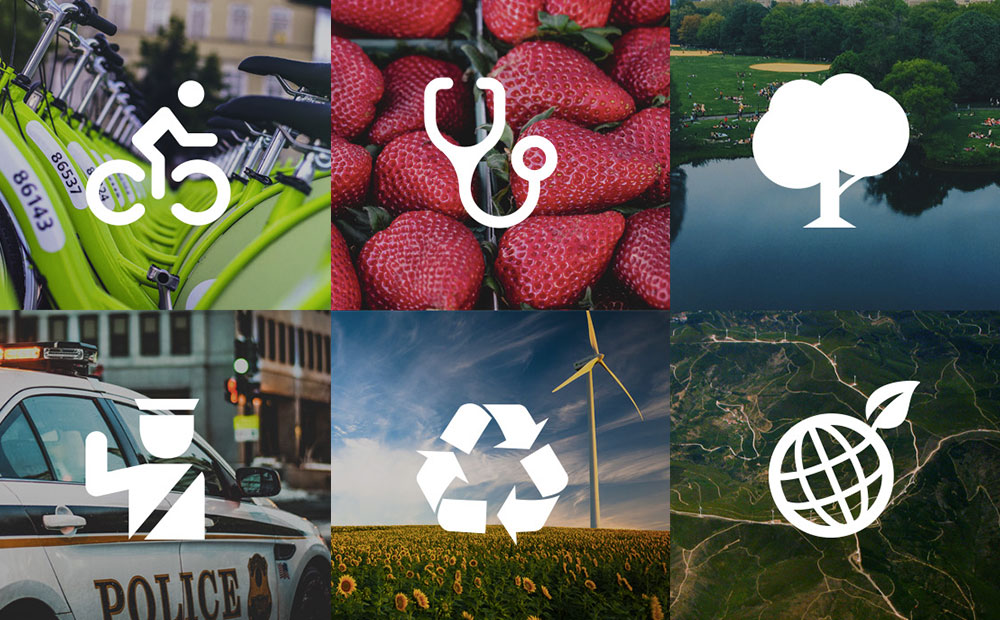
Open Civic Data Standards: Book of Adopted and Proposed Standards
The Open Civic Data Standards ebook outlines the status of open data standards in several civic domains and lists domains where there is strong potential for developing or defining new open data standards.
-
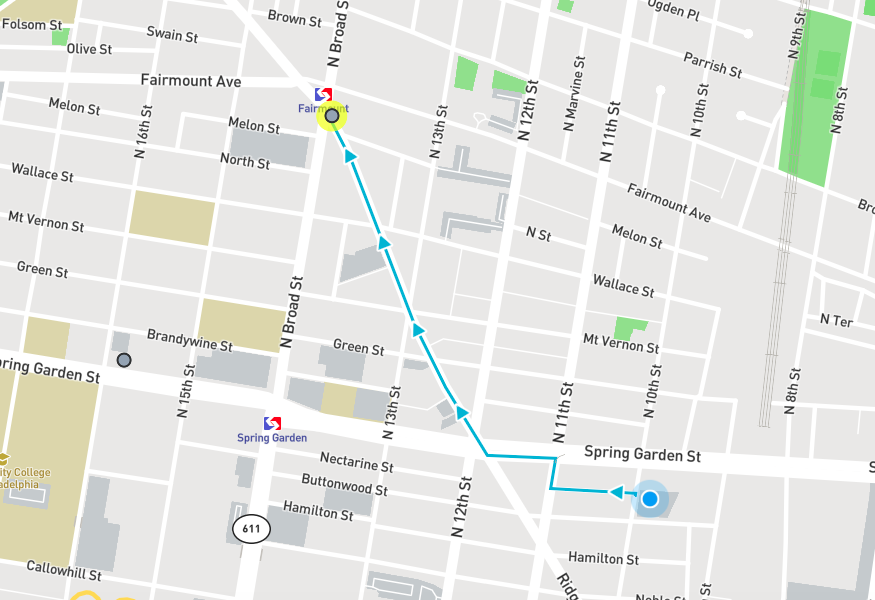
Find the Nearest Cheesesteak on National Cheesesteak Day
This web app built for National Cheesesteak Day provides walking directions to the nearest top ranked restaurant that serves cheesesteaks.
-
GeoTrellis 1.2 Release: New Features & Optimizations
LocationTech GeoTrellis, library that enables distributed processing of geospatial raster data, reached a new milestone in the development timeline.