
Element 84 employed user interviews, stakeholder workshops, and iterative dashboard design to improve The Sustainability Consortium’s Trade Model and Risk Calculator, now known as CommodityMap, with recommended actions for users and an improved interface. This tool was launched in May, 2024 and is free and easy to use – aiming to make sustainable supply chain choices more attainable for all. You can try it for yourself now!
The commodity mapping web tool redesign process
The Sustainability Consortium (TSC) is a university-based organization focused on improving the sustainability surrounding consumer goods and products. TSC established their commodity mapping program to aid companies in analyzing commodity sourcing data to prioritize engagement on environmental and social issues in their source regions. After initial discovery work was conducted by TSC, our team at Element 84 was brought into this work to re-conceptualize this system into a functional and streamlined web application.В
Although TSC performed commodity mapping analyses for members for several years before partnering with Element 84, the system was a time consuming and largely manual process. Through this redesign, the application features more automation, yielding immediate insights for users, and now includes clear actions companies can take to reduce their relative risk.
How we built the solution
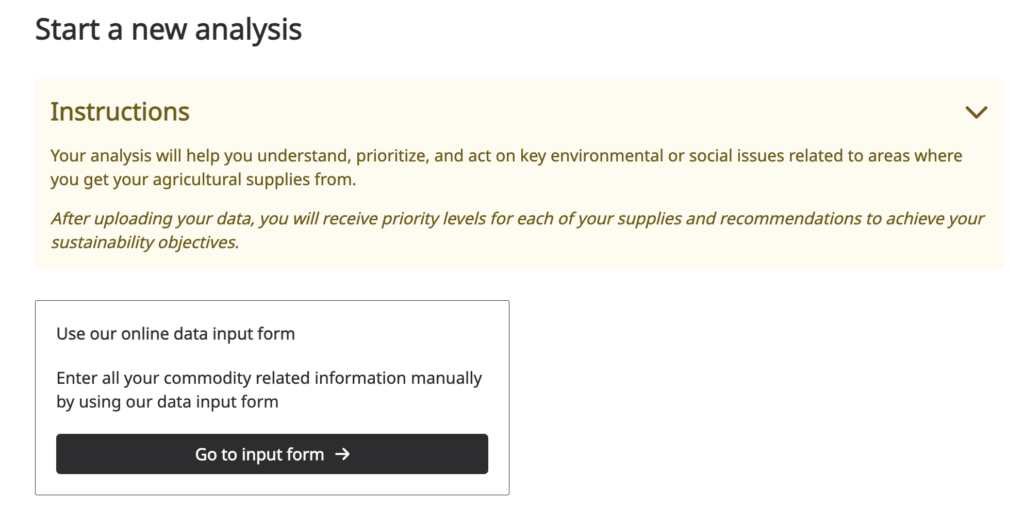
Now called CommodityMap, our work to design TSC’s commodity mapping process started with further discovery and user testing research.
When we first learned about this project, TSC had already conducted preliminary discovery work. This said, our team determined that a more extensive design discovery process would be necessary in order to truly deliver an end result that met the needs of users.
Our in-depth discovery process
Our team conducted a half day virtual stakeholder workshop as well as user interviews in order to glean crucial information about how to improve the application and how to incorporate the new elements the TSC team was requesting, such as recommended actions specific to the commodity-issue combinations flagged by the models.
Our team presented our findings to TSC, and elements from this process went on to shape the development of the final product. One key element we considered heavily throughout this phase of work was alignment with the overall TSC strategy. Generally speaking, TSC recommends and is interested in companies choosing to invest in improving their supply chain rather than divesting from a given source region or supplier.
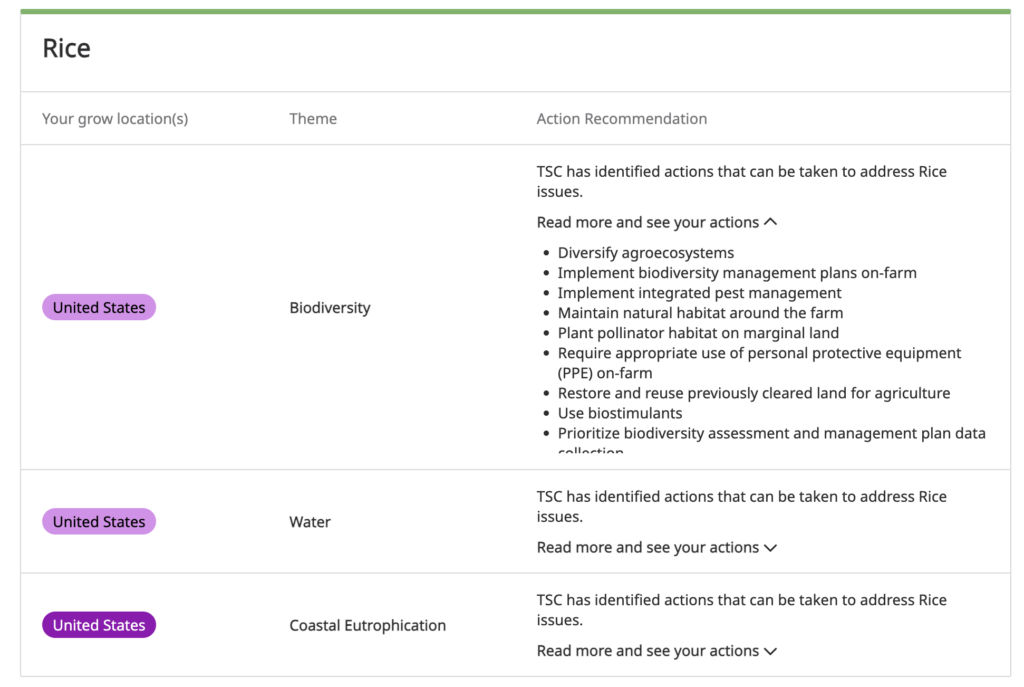
Because of this company value, our team gathered specific feedback from users to shape how the application might ultimately be able to encourage companies to choose supply chain improvement when faced with high priority environmental or social issues. In response, we designed a system that highlights TSC’s science-based recommendations to begin addressing these high priority issues.
This also matched user expectations – our discovery revealed that users wanted both high level insights and specific instructions on how to address them. We then began our redesign with a clear focus on giving quick insights, which were supported by detailed information and actionable next steps.
Building a functional design based on feedback from users
Ultimately, this project centered around a visual design process resulting in a series of detailed wireframes and high-fidelity mockups that TSC implemented to inform current elements of their commodity mapping system. Through surfacing crucial information for users and presenting it in a clear and concise way, we focused on shaping users’ experiences to make the tool more functional for everyone who might use it in the future.
Why our solution works
Our final designs allow organizations to compare individual commodities they source across various social and environmental risk factors. The updated tool features risk analyses that include maps relating to commodity origin and recommendations designed to guide traceability and sustainability efforts for companies.
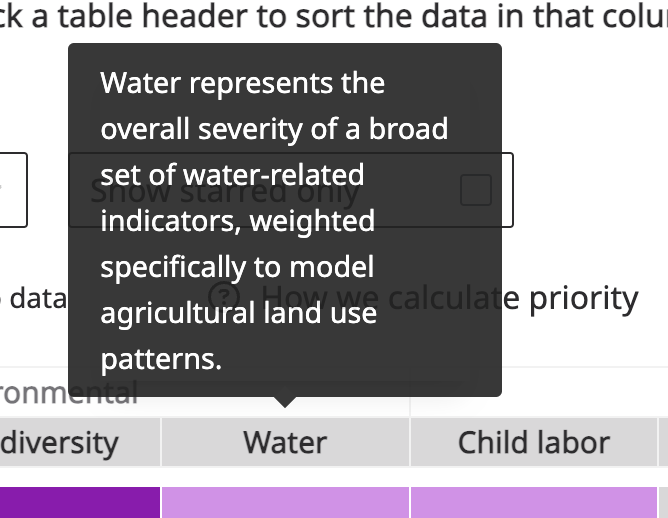
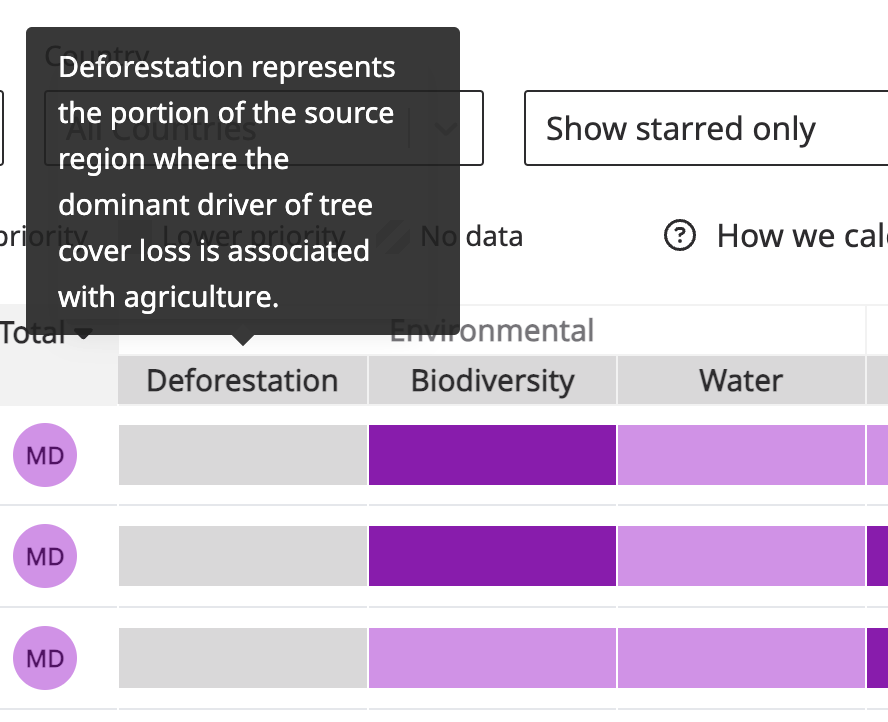
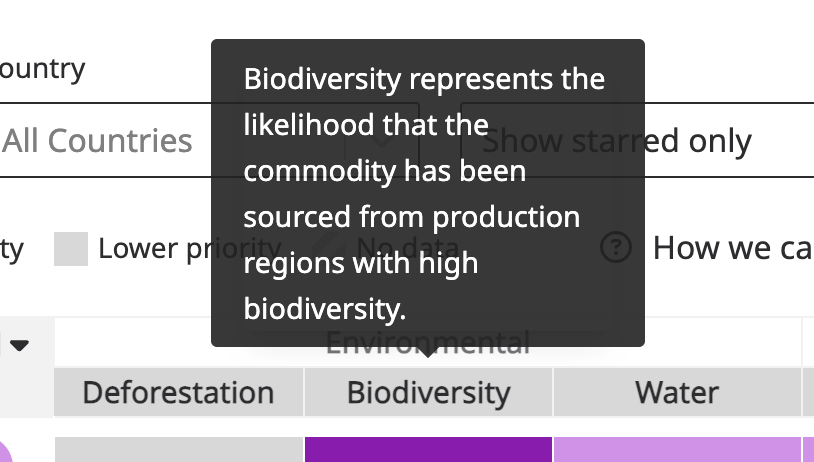
One of the key design elements featured in CommodityMap is the responsive table. This table allows users to easily see their highest priority environmental and social issues across multiple commodities. This table is particularly effective because it is responsive, allowing as much data as possible to be featured on larger screens, and it has color highlighting built in to help the user identify priority issues. These features ensure that, although the data features a lot of important information, users can quickly discern what is most relevant for their specific needs and connect it to clear next steps for actionable change.
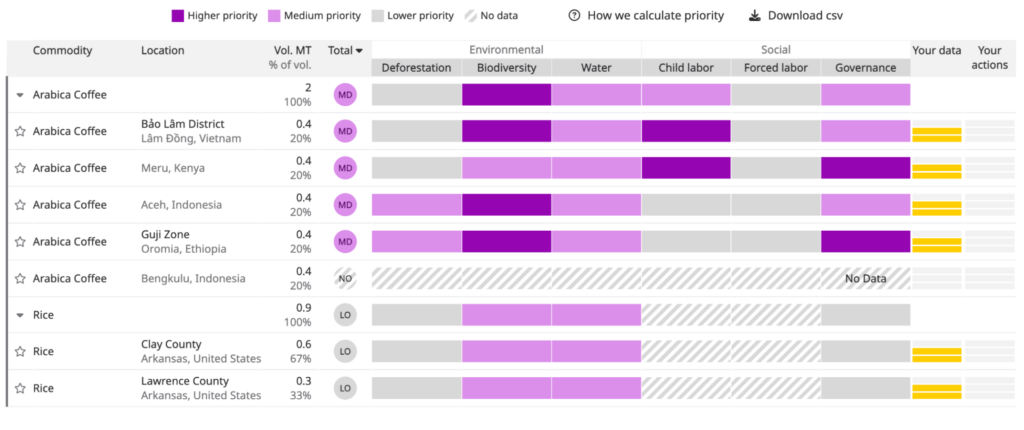
Reception of the tool has been positive, with users appreciating its ability to provide actionable insights. Dee Andrews, Director of Legal, Environmental and Corporate Affairs at Norcom, noted that, “the tool homed in on individual metrics, and there was usually one metric (biodiversity, child labor, etc.) that was high-risk. This allowed us to quickly determine risks for each region and take appropriate action.”
If you are interested in design solutions that directly meet the needs of your audience, we’d love to hear more about your work. Reach out to our team here for more information about this project and how we’re taking these ideas to the next level.В