At this week’s AGU (American Geophysical Union) conference in Washington DC, we presented an innovative approach to analyzing temporal changes in remote sensing imagery using natural language. The full abstract for our talk, Natural Language Driven Geospatial Change Detection with Vector Embeddings, is available on the AGU website. This technology builds on our ongoing development of generative AI and vision models that enables users to explore our world through natural language queries.
This approach makes it possible to: :
- Identify all types of changes in an area including urban development, construction activity, infrastructure improvements, and environmental changes
- Search for specific changes using natural language queries (e.g., “Find areas where forests have been replaced by housing”)
- Define temporal and spatial boundaries using natural language (e.g., “within the last 2 years over the western half of Georgia”)
- Generate text-based summaries of changes over an area (e.g. “Describe all of the changes to energy infrastructure within 5 miles of Boston over the last 3 years”)
Queryable Earth with Natural Language Geocoding
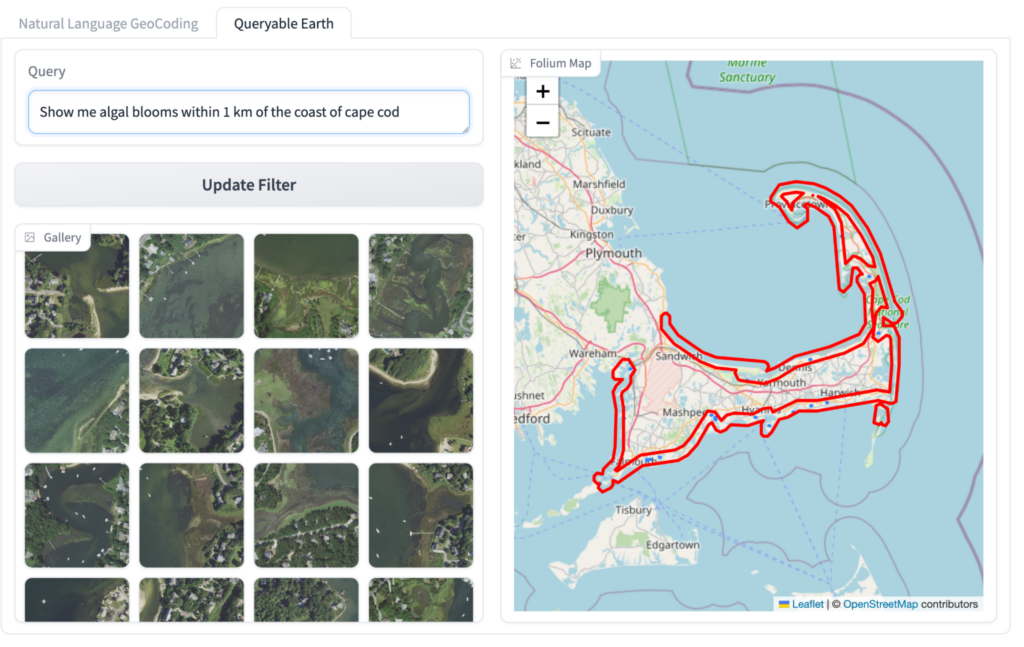
In our queryable earth blog post, we showed how vector embeddings from CLIP-based models can be used to quickly find everything from a single tree in a field to solar panel installations. (See this earlier blog post for an explanation of vector embeddings.) Since then we have continued to build on that approach by adding capabilities like Natural Language Geocoding, which lets users specify locations using natural language descriptions like “within 2 kilometers of the coast of Maui west of Haleakala”. Putting these together, we can create an intuitive interface for finding anything on the earth.
Vector Embeddings for Change Detection
Vector embeddings are an aspect of vision models with the ability to represent the important semantic content of an image as a list of numbers, i.e. a vector. Think of ‘semantic content’ as ‘what the human eye and brain understand’ when looking at an image. For example, when you look at a photo of a forest being cleared for a housing development, a traditional change detection approach might see pixel-level changes. In contrast, our system sees it the way you would: ‘This used to be a forest, and now it’s being turned into houses’.
As discussed in greater detail in this blog post, this property can be exploited to detect changes in a given area over time. When vectors are similar to each other, the contents of the images are semantically similar. Smaller distances represent less significant changes than larger distances. It’s not just that the pixels are different, it’s that the underlying content of the image, i.e. a forest, is now different, such as deforestation for farmland. While comparing vector embeddings of images can help us identify the presence or absence of a change, it does not tell us the type of change that has occurred. However, if your image embeddings are text-aligned (i.e. the embedding model can encode both images and text to the same embedding space), as is true for embeddings from CLIP-based models, you can actually begin to tease out the nature of the change e.g. deforestation, creation of new sporting facilities, installation of solar power, new housing, port facility expansion, removal of buildings, etc.
Determining What Has Changed
So how do we figure out the type of change from vector embeddings alone? Given image embeddings of the same area from two different time periods, we can compare each of them to the text embedding of the same concept, such as “forest” or “solar panel”, and see if there is a significant difference in how closely they match the text embedding. For example, if the older image embedding has a high similarity with the embedding for “forest” but the newer one does not, we can infer that deforestation has occurred in that area. Similarly, if the newer one has a high similarity with “solar panels” while the older one does not, we can infer that solar panels have been installed in that area. A slightly different way to do the same thing is to compare the text embedding not to the image embeddings themselves but rather the difference (itself a vector) between them. We found both approaches to yield very similar, though not identical, results in our experimentation.
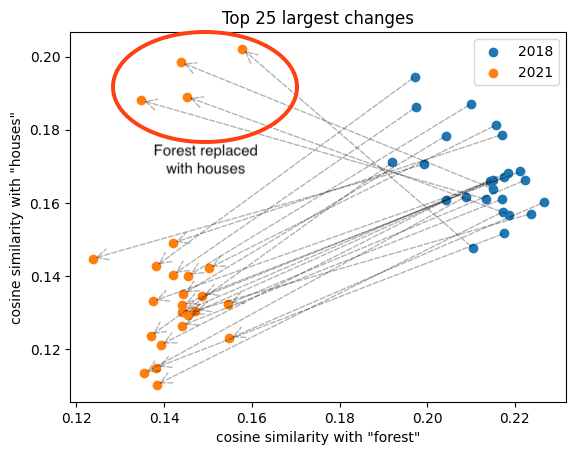
A more interesting challenge is to figure out not just what has been added or removed but exactly what has changed into what. For instance, suppose we wanted to find areas where a forest has been cut down to make room for a residential area. We could do this by looking for pairs where the old image embedding strongly matches “forest” while the newer embedding strongly matches “houses”. One interesting way to (indirectly) visualize this change in the embedding space is to visualize the image embeddings as points on a 2D plane with one axis representing the similarity with “forest” and the other with “houses” (as shown in the plot below). This allows us to visualize the changes as movements of points within this plane. A movement towards the top left in this plot (as exhibited by the four circled points) can be understood as images becoming less forest-like and more houses-like. The cases where both points seem to be moving towards the bottom-left are cases where forests have been removed with something other than houses.
Examining the image-pairs corresponding to the four points that moved in the top-left direction, we see clear instances of forests being replaced with houses:
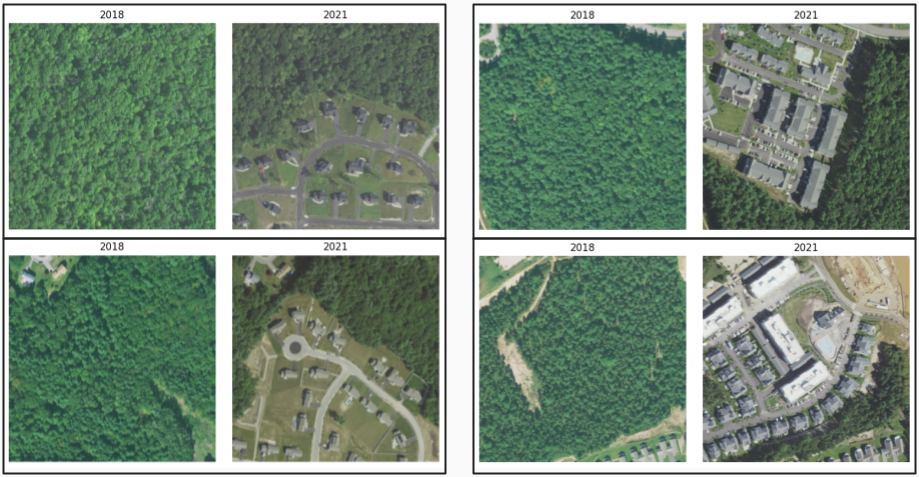
This approach allows us to generate coarse textual descriptions of the kinds of changes that have occurred over time and can be especially powerful when applied to large spatial areas.
Comparing Change Detection with Vector Embeddings to Traditional Change Detection
There are many other methods of change detection including pixel-based approaches like Image Differencing and Change Vector Analysis, object-based approaches, and Machine Learning approaches like Supervised learning which involves fine tuning or training a model with prelabeled datasets with pixels marked as changed or unchanged. There are different advantages and disadvantages of each.
Some of these approaches share a common requirement: the need for geometric and radiometric alignment to account for things like sensor geometry, viewing angle, satellite movement, sun angle/intensity, and atmospheric conditions. Unaccounted for variations will potentially show up as false changes. This is very challenging to get right and is typically focused on measuring a very specific kind of change like land cover.
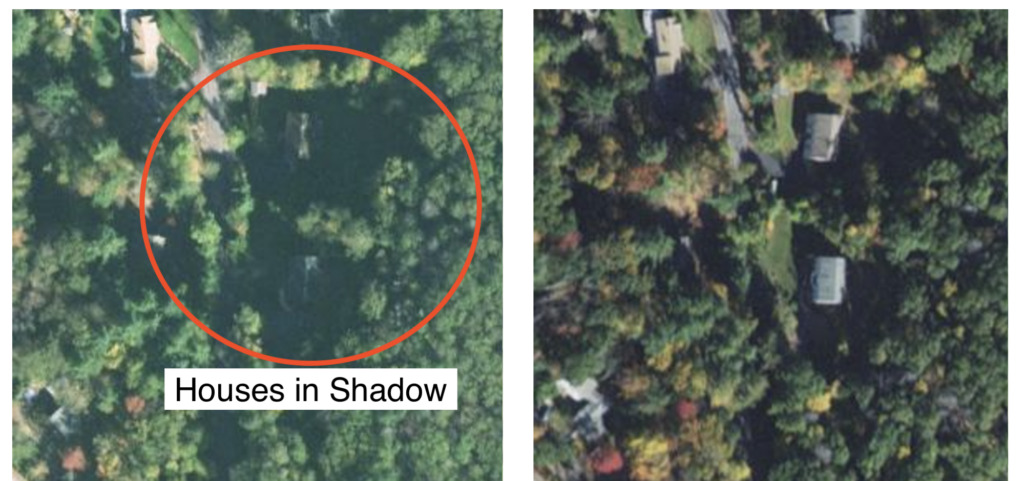
While we have not done a comparative accuracy assessment, initial experimental results show the approach with CLIP-based vector embeddings may remove many of these limitations. Because the vector embeddings are based on the visual spectrum and extract the semantic contents of the images, as long as the underlying image still looks visibly like the same thing then brightness, haze, and relatively small geometry differences won’t show up as changes. However, more significant differences would still impact the ability to detect changes or produce false changes. For example, snow can make it difficult to see details on the ground or seasonal foliage changes can look like deforestation. Shadows can also hide details if the pictures are taken at different times of day.
As with traditional change detection, getting images at the same time of day and year can help avoid seasonal or time-of-day differences. Additionally, this approach could miss small changes where the underlying semantics of the image aren’t changing such as the addition of a single house in a crowded neighborhood. Combining this approach with object detection and counting would be one potential solution for that use case.
Large image misalignment will obviously cause problems with this approach if features are cut off in subsequent images. We strongly recommend that organizations generating their own vector embeddings make sure to have consistent chip geometry over time. It doesn’t have to be pixel precise, but ideally they should be aligned so that features are not cut off at the edges. You don’t want to spend a lot of effort generating vector embeddings over millions of scenes to find that you can’t actually compare them over time. Our team of experts at Element 84 is happy to help if you’re considering going down this path.
Describing the Changes
While we have shown how to identify, at a high level, the types of changes from vector embeddings, this falls short of a detailed description of the changes such as a human might produce while looking at a pair of “before” and “after” images. But we can get pretty close to something like this via multimodal LLMs. Multimodal models like Anthropic’s Claude and OpenAI’s GPT-4 are great at extracting information from images like descriptions. Building on top of the approaches discussed in this blog post allows us to generate summaries of changes across a large area. Here’s an excerpt of the response we can generate when asking for all of the changes between 2018 and 2021 within 3 miles of Boston.
I can summarize the largest changes from 2018 to 2021 within 3 miles of Boston as follows:
- Urban Development: There has been significant urban expansion and redevelopment …
- Construction Activity: Numerous construction projects have been completed or are ongoing …
- Coastal and Maritime Changes: There are notable changes along the waterfront, …
- Recreational Area Modifications: Several sports fields and park areas …
- Infrastructure Improvements: New roads, transit lines, and parking …
- Environmental Changes: Some forested areas have been partially cleared …
- Industrial Transformations: Some industrial areas have been demolished …
- Renewable Energy Initiatives: New installations of solar panel …
All of that information is derived simply from the imagery. While it might seem like this would be limited, expensive, and slow, we can provide this capability very quickly and inexpensively. The summaries can be broadened for any type of change or narrowed to spotlight specific categories such as environmental, energy infrastructure, or transportation.
Exploring Changes with Natural Language
We’re really excited about these approaches for searching for and understanding changes over time. But how do we put this in the hands of users without requiring advanced ML or geospatial expertise? Obviously it’s possible to build customized user interfaces that are well suited to specific user needs. Generative AI gives us the ability to build interfaces that let users explore changes without having to always customize it for a specific domain. Using other approaches we’ve developed like Natural Language Geocoding lets users describe exactly what they’re looking for like the following:
- “Can you summarize the visible changes to transportation infrastructure over the last 5 years around New York City?”
- “Where have solar panels been built between 2018 and 2021 in Massachusetts?”
- “Find forests that have been cleared for houses within 5 miles of Wachusett Reservoir”
We continue to be amazed at what we can achieve by composing together geospatial, machine learning techniques, and generative AI. Our team would love to help kick-start these efforts at your organization – get in touch with us to chat more about your work.В