All blog posts
<- View categories
-
Introducing Raster Vision 0.12
We refactored the Raster Vision codebase from the ground up to make it simpler, more consistent, and more flexible. Check out Raster Vision 0.12.
-
Introducing Raster Vision 0.12
We refactored the Raster Vision codebase from the ground up to make it simpler, more consistent, and more flexible. Check out Raster Vision 0.12.
-
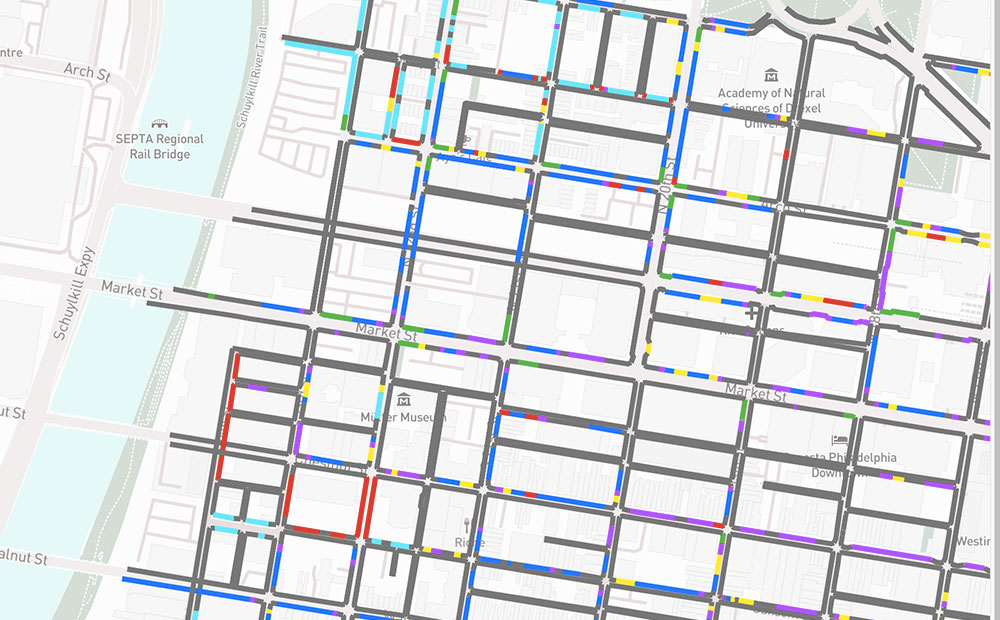
Maintaining Data on the Curb with CurbLR: A New Open Standard
CurbLR is a promising new open data specification for curb regulation. We used it to visualize and analyze Philadelphia’s curb management approaches affect on traffic.
-
SpaceNet Data Now Available in GroundWork
Incorporate high-resolution satellite imagery into your labeling projects for free.

-
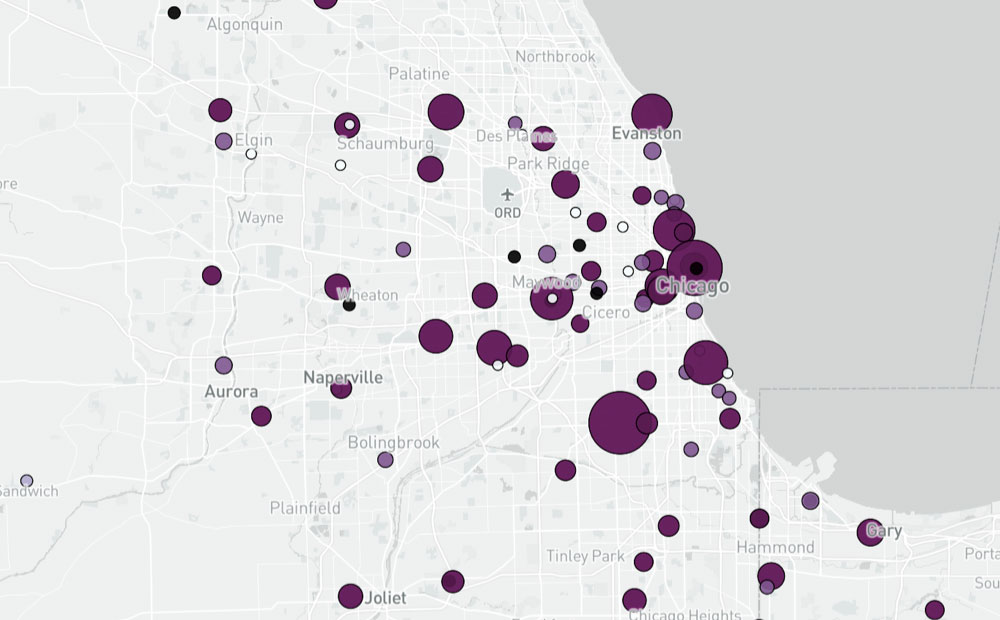
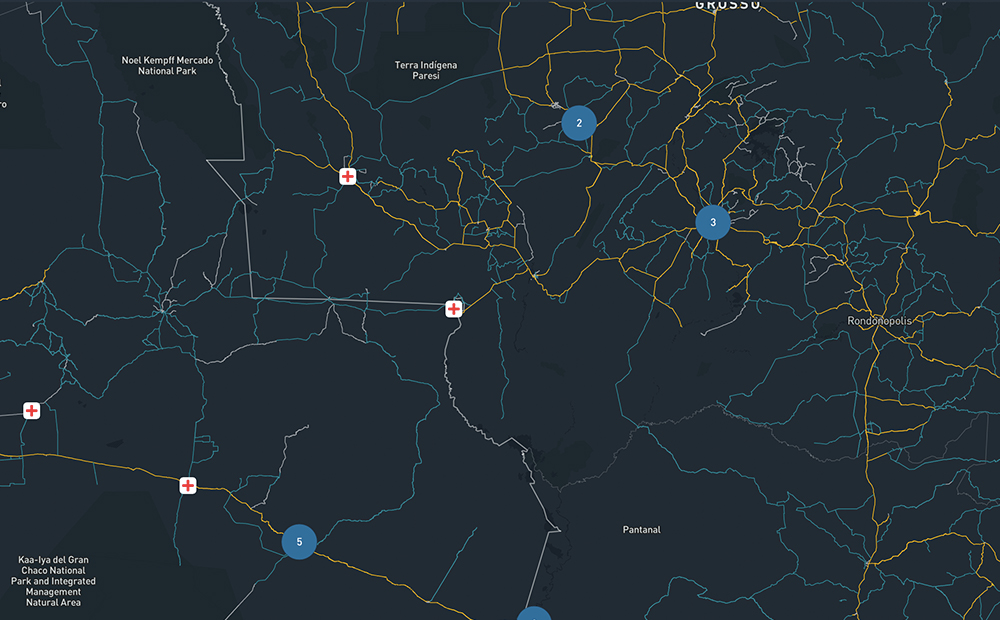
How We Built a National Hospital Dataset for Coronavirus Relief
We pulled data from disparate hospital data sources to create a comprehensive national dataset of the hospital system for the COVID-19 response, using geocoding, proximity matching, and fuzzy string matching.
-
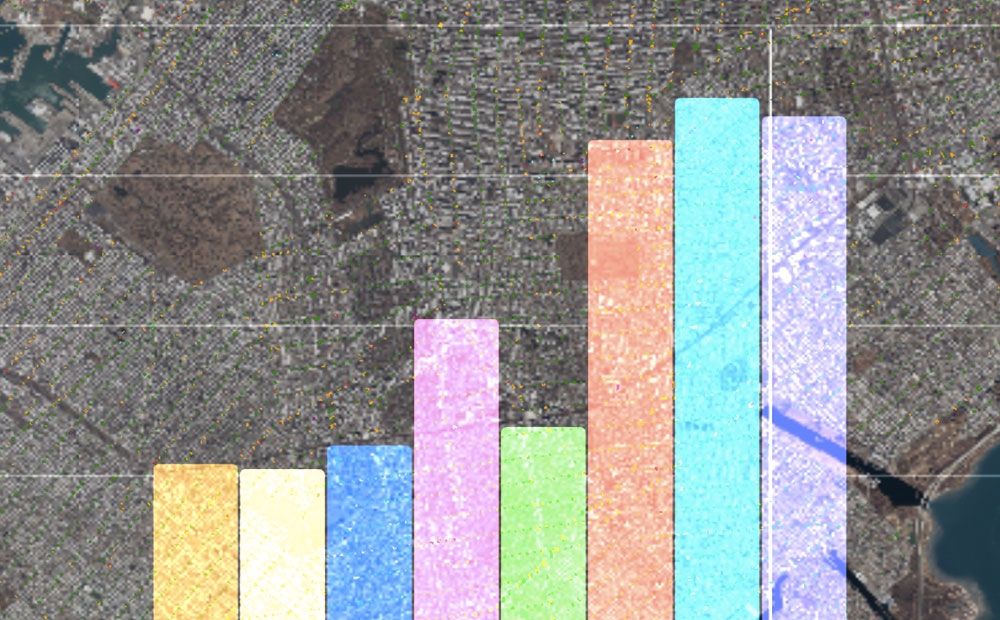
Image Classification Labeling: Single Class versus Multiple Class Projects
When labeling for image classification is it faster to complete projects with single or multiple classes? We ran an experiment to find out.
-
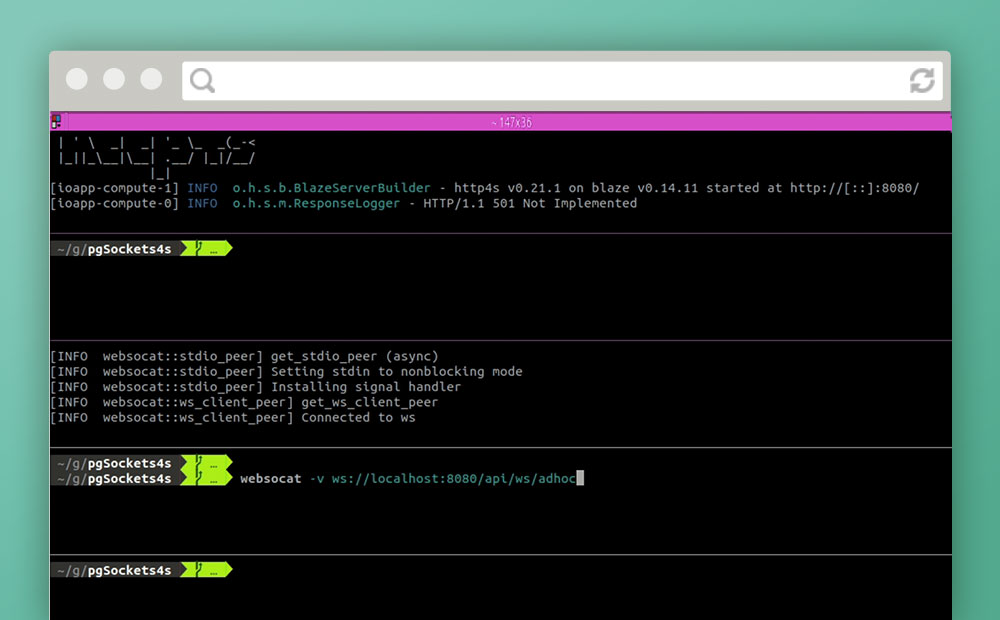
Notifications over Websockets with Http4s and Skunk
In an attempt to avoid relying on polling in a front-end application or third-party services, we attempt servicing asynchronous notifications over websockets using only PostgreSQL and Scala.
-
Revisiting the Ethics of Project Selection
A major part of how Azavea pursues its mission is tied to how we select our projects. As our work on Earth observation imagery has grown, we felt it was time to develop a guideline around a new industry: energy.
-
Prototyping Your Way to Good UX
I’m going to come right out and say it: prototyping is the most powerful tool in your UI/UX tool belt. Let me clarify. I still think of prototyping as one of the many ways to extract valuable information and iterate on a design–like user research or card sorting–but I now put prototyping at the top…
-
Hosting An Online Conference: Philly Emerging Technology for the Enterprise (ETE)
Conferences are great for a variety of reasons–getting exposed to cool up-and-coming technologies, connecting with old friends, and doing recruiting and business development. For the last few years, I’ve been a co-organizer for Philly Emerging Technologies for the Enterprise (ETE)–a fantastic developer-focused conference that has run in Philadelphia for fourteen years. While ETE was planned…
-
Can AI Reduce Harm to Children?: Gabriel Fernandez and the Case for Machine Learning
Could AI have saved Gabriel Fernandez’s life? Data and social scientists argue that machine learning might have kept him alive. What exactly is this potentially life-saving AI? Learn more about predictive risk modeling, how governments currently use similar AI, and the ethical questions such work raises.