Author: Aaron Dennis
<- Return to all blogs
-
Leveraging Node.js, D3.js, and HTML Canvas for Scalable Infographics
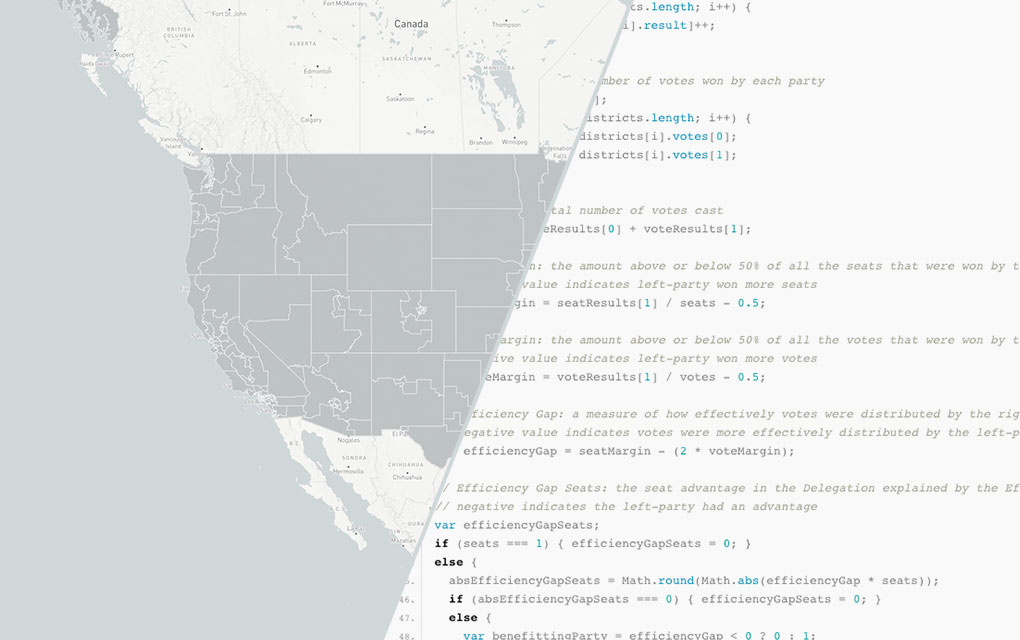
In Part 3 of our 3-part series on Azavea’s redistricting and gerrymandering work, we look at the technical process behind developing infographics for efficiency gap reports. We made strategic use of JavaScript visual tools and Node.js as a scripting language in our design and production of 50 infographics about the efficiency gap, automatically creating one for…
-
Leveraging Node.js, D3.js, and HTML Canvas for Scalable Infographics
In Part 3 of our 3-part series on Azavea’s redistricting and gerrymandering work, we look at the technical process behind developing infographics for efficiency gap reports. We made strategic use of JavaScript visual tools and Node.js as a scripting language in our design and production of 50 infographics about the efficiency gap, automatically creating one for…