Data Analytics
<- Return to all blogs
-
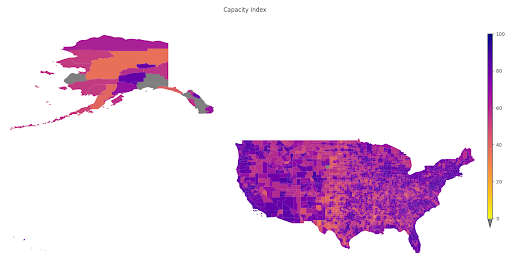
A Tool to Highlight Underfunded and Under-resourced Communities: A Peek Behind the Technical Curtain of Headwaters Economics’ Rural Capacity Index
To address the disparity in access to funding resources, we partnered with Headwaters Economics to develop the Rural Capacity Index.
-
A Tool to Highlight Underfunded and Under-resourced Communities: A Peek Behind the Technical Curtain of Headwaters Economics’ Rural Capacity Index
To address the disparity in access to funding resources, we partnered with Headwaters Economics to develop the Rural Capacity Index.
-
Top 7 Reasons to Make Your Excel Spreadsheet into a Web-Based Application
We’ve seen a trend in requests from potential clients. Organizations are bringing us complex, built-in-house Excel spreadsheets and asking us to convert them into web-based decision-support tools to make their data more useful, user-friendly, and secure.

-
How Can OpenStreetMap be Used to Track UN Sustainable Development Goals?
We learned that OpenStreetMap is a great source of data for tracking SDG indicator 11.7.1. OSM provides data on public open or green spaces in cities that is similar in quality to more “official” sources like municipal Open Data portals, and collecting the data from OSM requires relatively little effort.
-
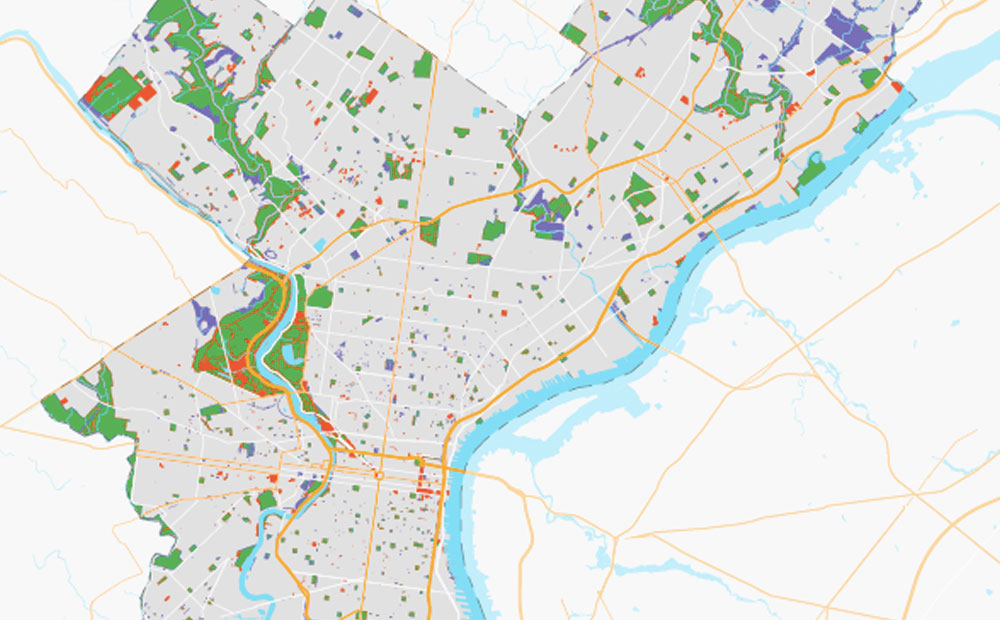
Using GIS to Guide Philadelphia’s First Neighborhood-Level Forestry Plan
The adoption of Philadelphia’s Urban Forest Strategic Plan and Hunting Park’s Forestry Plan presents a unique opportunity to address the need for equitable tree planting and the reduction of heat vulnerability, as these two plans are the city’s first cohesive attempts to prioritize and manage its urban forest.
-
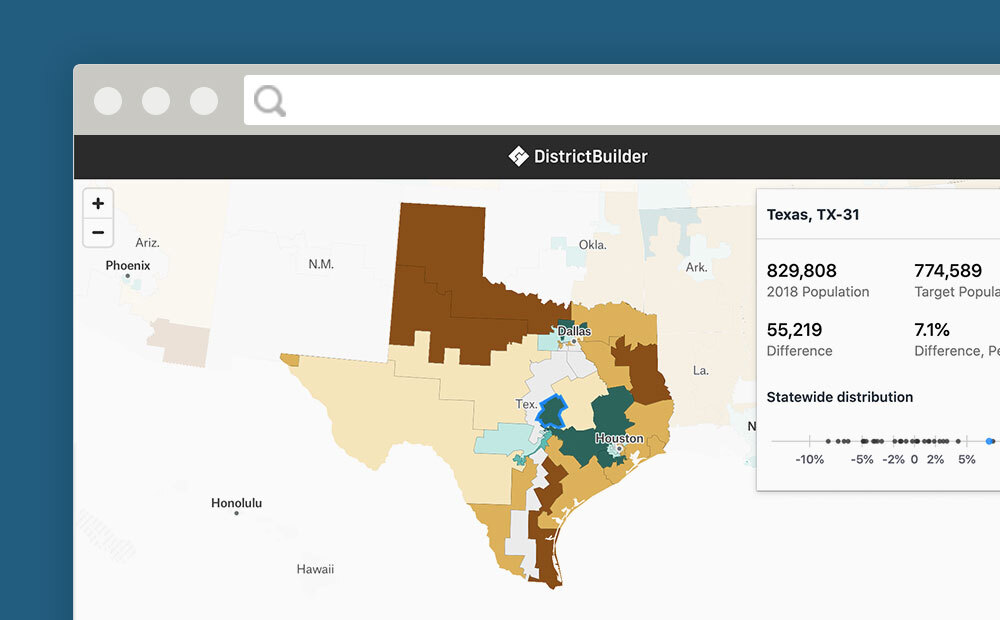
Which Congressional Districts are Over and Under Populated
We calculated which congressional districts have become over or underpopulated since they were last drawn.
-
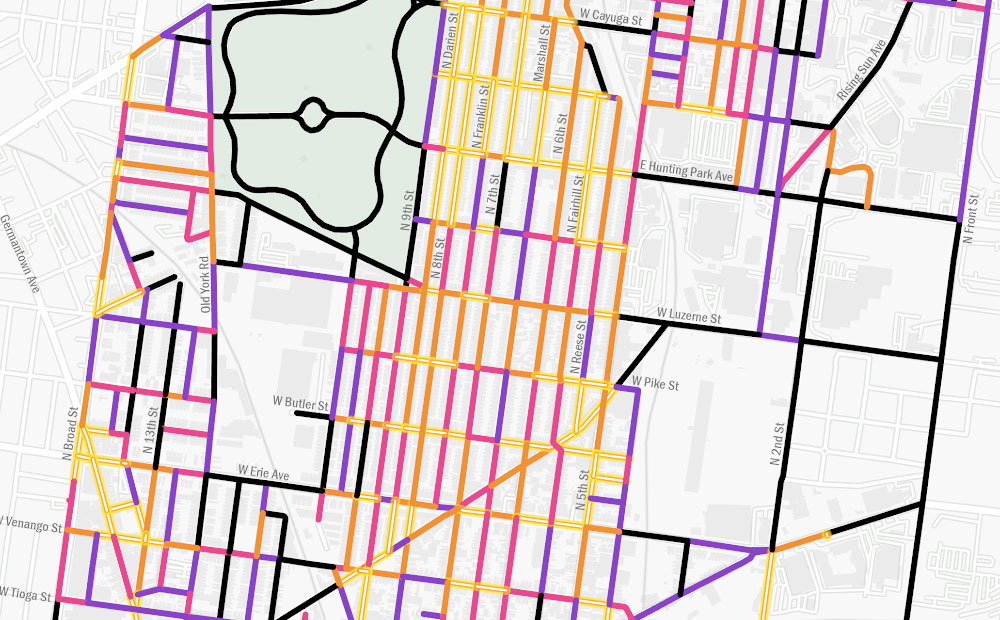
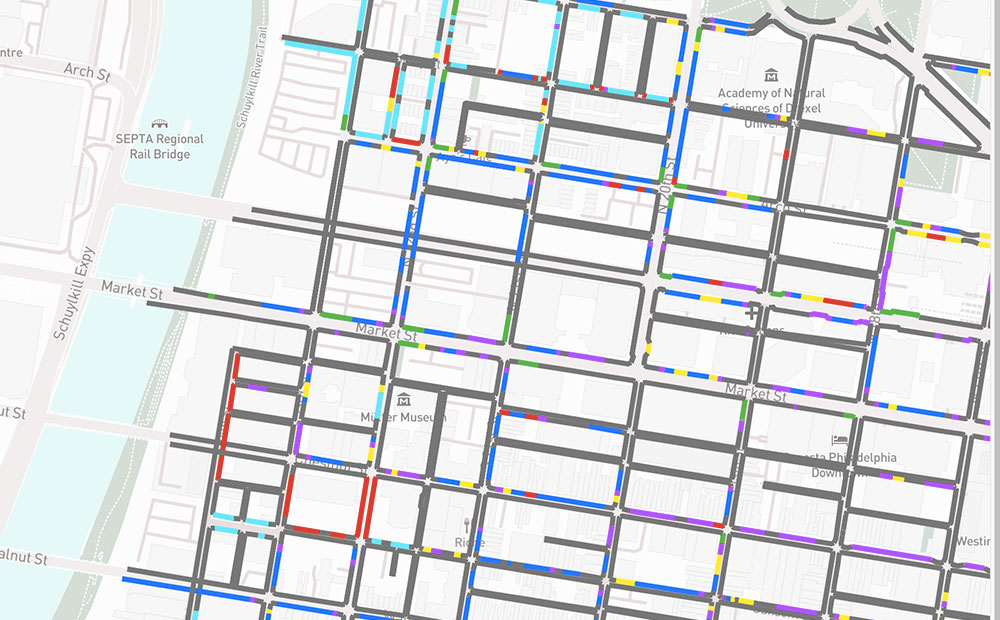
Maintaining Data on the Curb with CurbLR: A New Open Standard
CurbLR is a promising new open data specification for curb regulation. We used it to visualize and analyze Philadelphia’s curb management approaches affect on traffic.
-
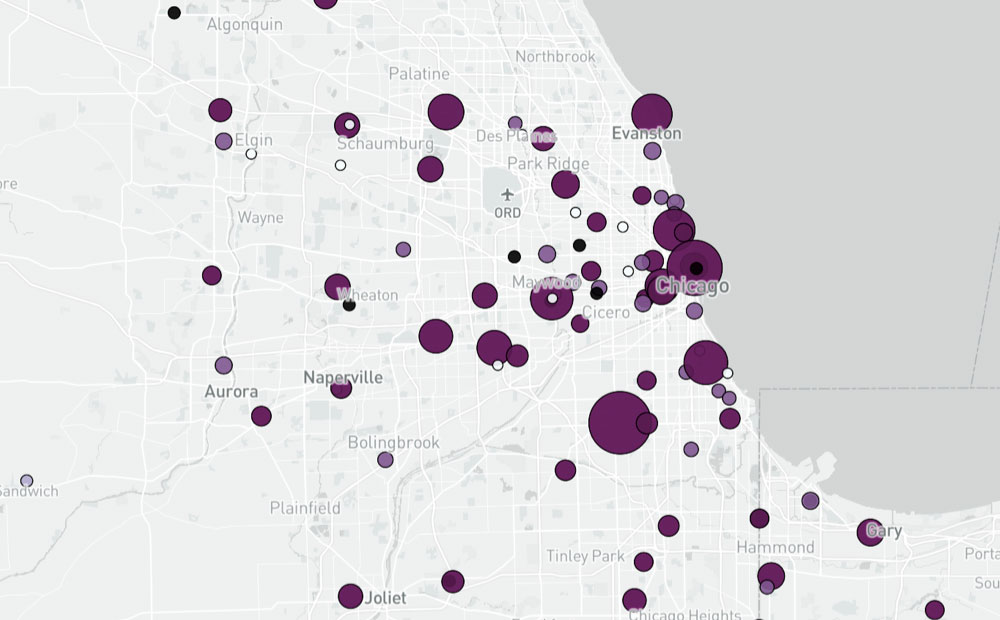
How We Built a National Hospital Dataset for Coronavirus Relief
We pulled data from disparate hospital data sources to create a comprehensive national dataset of the hospital system for the COVID-19 response, using geocoding, proximity matching, and fuzzy string matching.
-
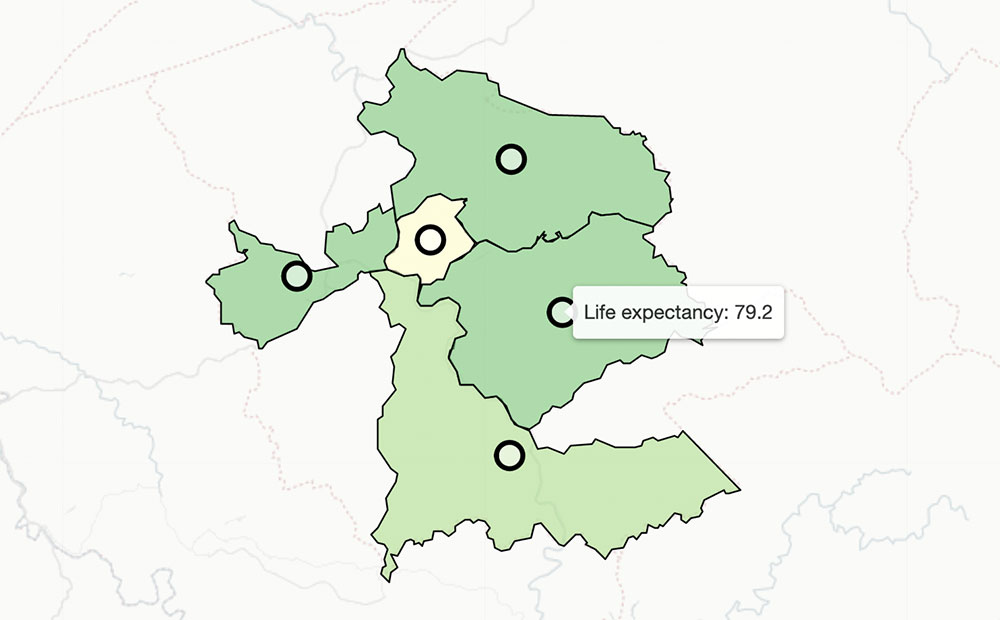
Analyzing Spatial Patterns in Life Expectancy with Python
All around the country boundaries separate neighborhoods with high and low life expectancy. We used python to find the most extreme examples.
-
Scoring Philadelphia’s City Council Districts for Children’s Health and Well-being
Scoring Philadelphia City Council districts on assets and risks using a weighted spatial analysis model in R and Python.

-
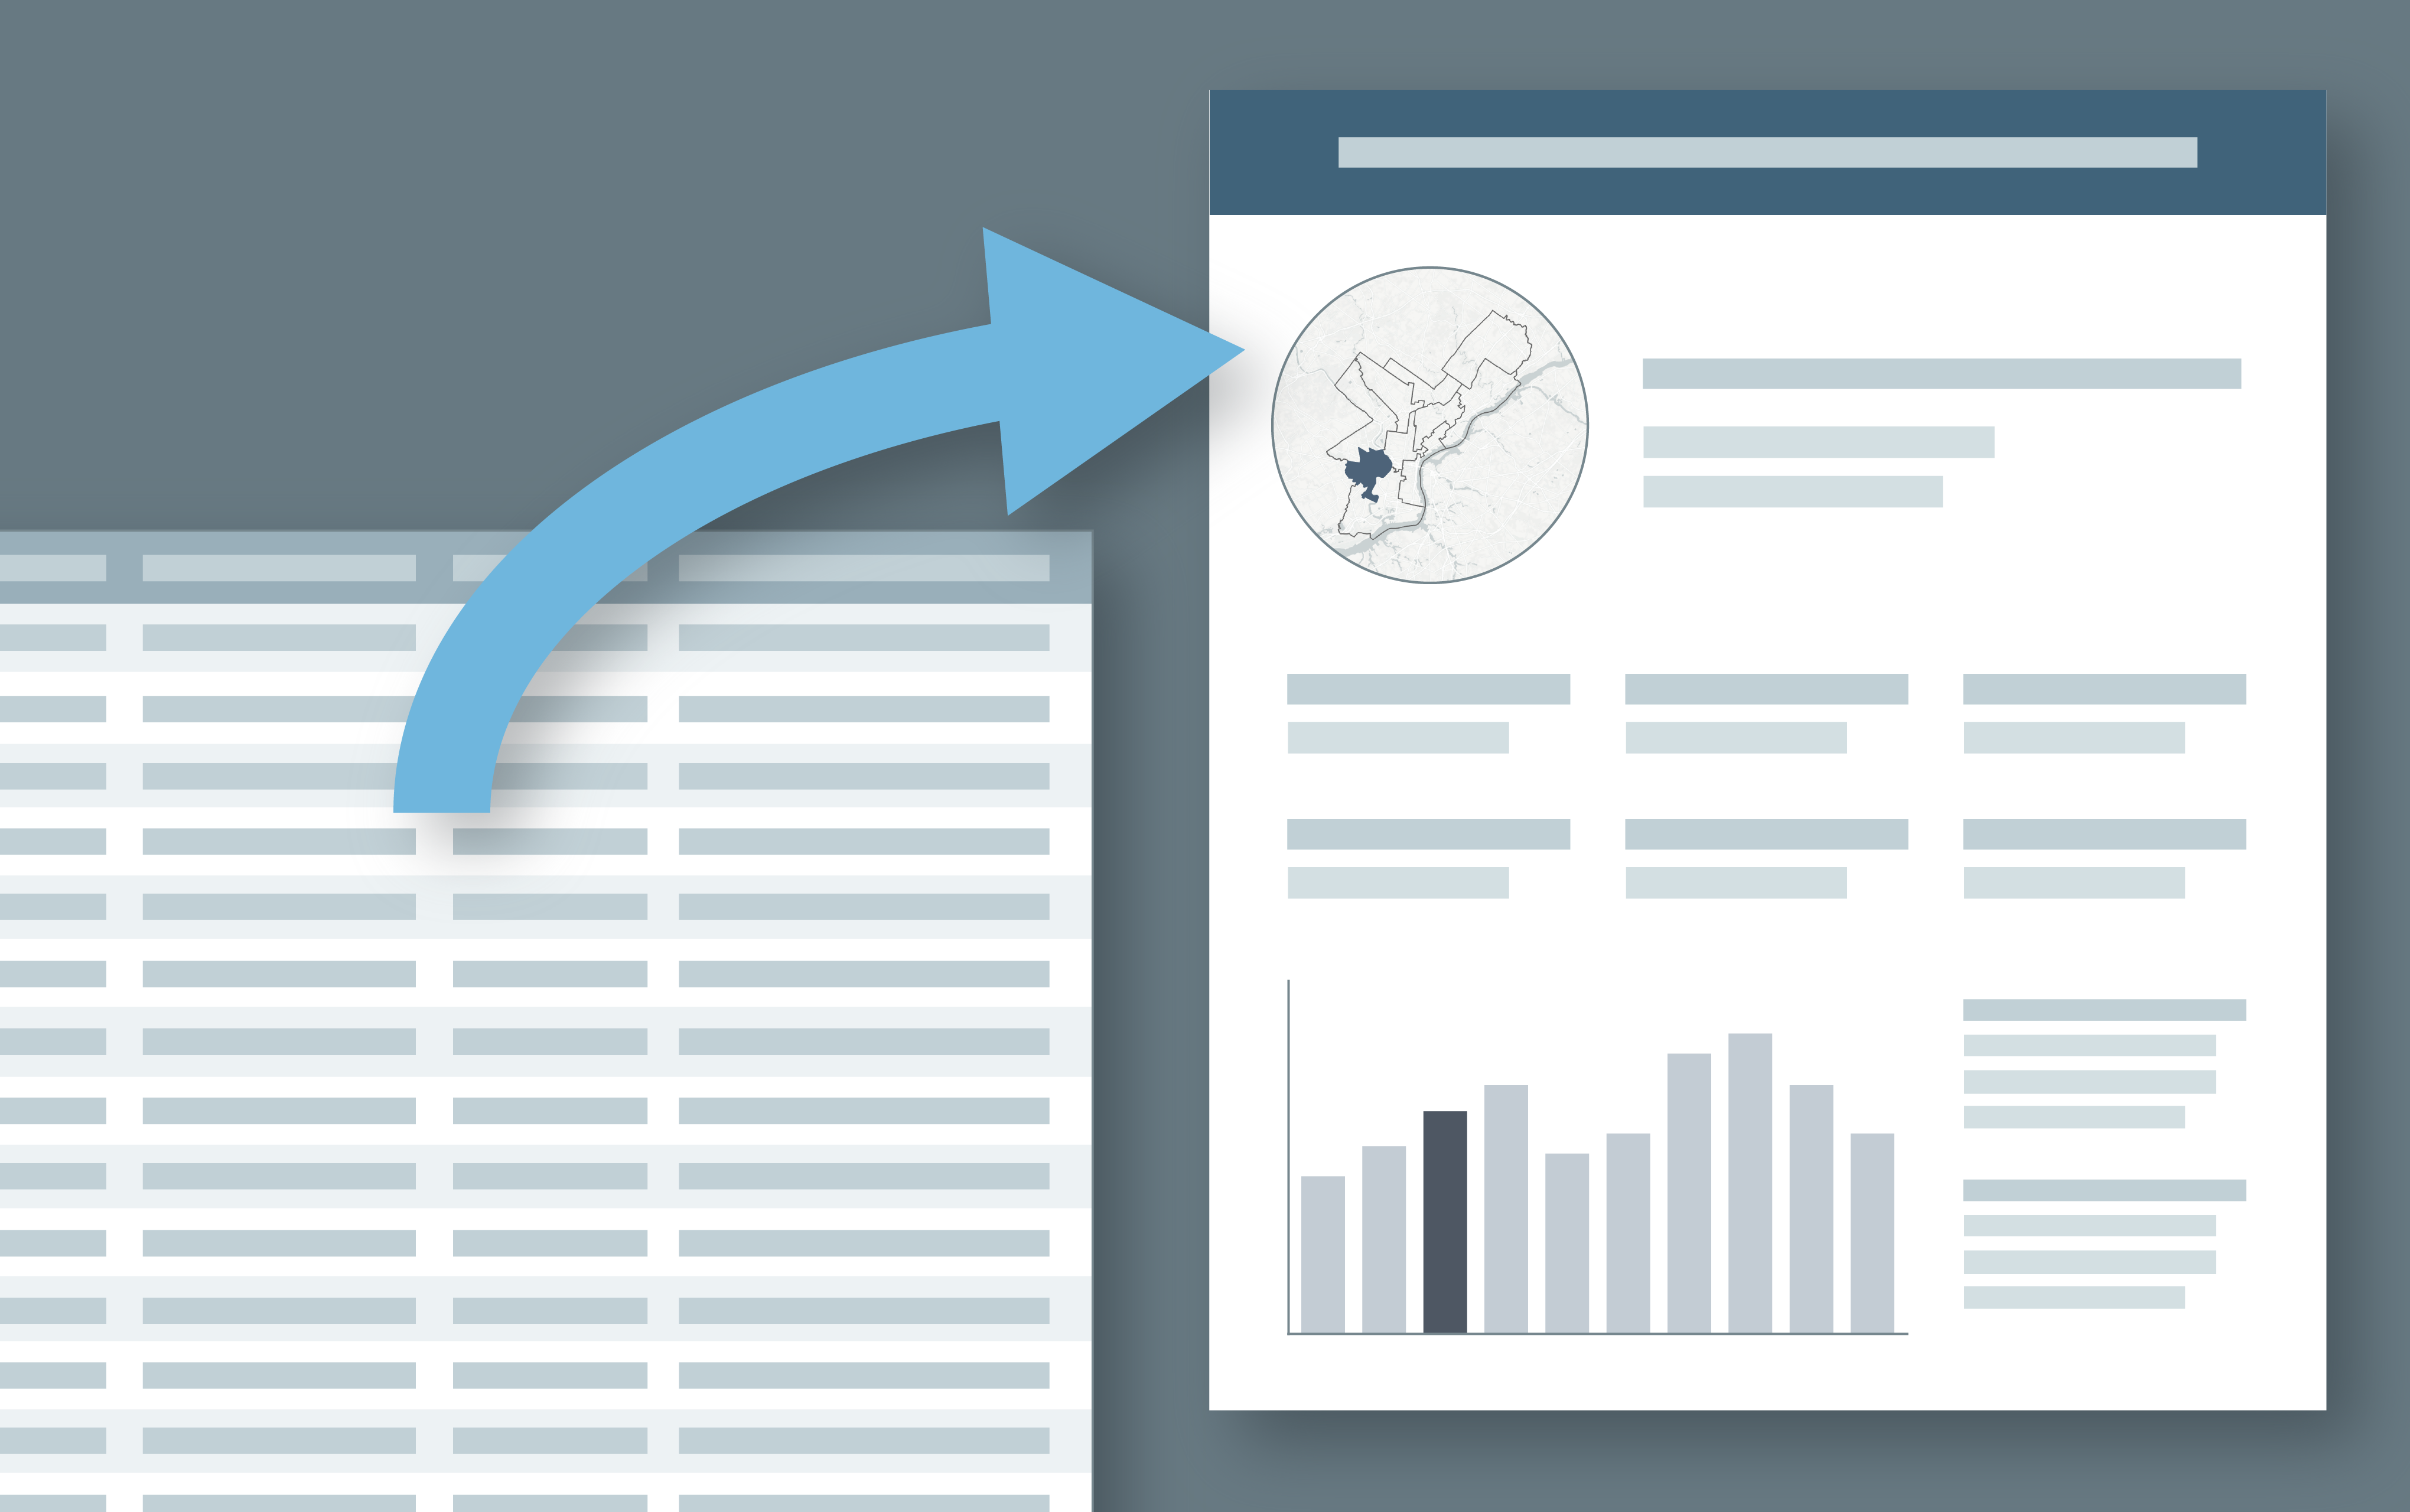
Using ArcMap, R, and Adobe Illustrator to Create Data Driven Infographics
Learn to create a series of data-driven infographics in the context of a project that evaluates bus performance in each Philadelphia City Council District.