Spatial Analysis
<- Return to all blogs
-
5 Questions You Can Answer with Maps and Data Visualizations
The Azavea Data Analytics Team is holding the last installment of the Map Readiness webinar series on March 22nd, 2017 from 2-3pm EST. We’ll walk you through the analytics techniques and tools we use to help our nonprofit partners answer their biggest questions. Optimize Your Nonprofit As you may know, we at Azavea’s Data Analytics Team…
-
5 Questions You Can Answer with Maps and Data Visualizations
The Azavea Data Analytics Team is holding the last installment of the Map Readiness webinar series on March 22nd, 2017 from 2-3pm EST. We’llВ walk you through the analytics techniques and tools we use to help our nonprofit partners answer their biggest questions. Optimize Your Nonprofit As you may know, we at Azavea’s Data Analytics Team…
-
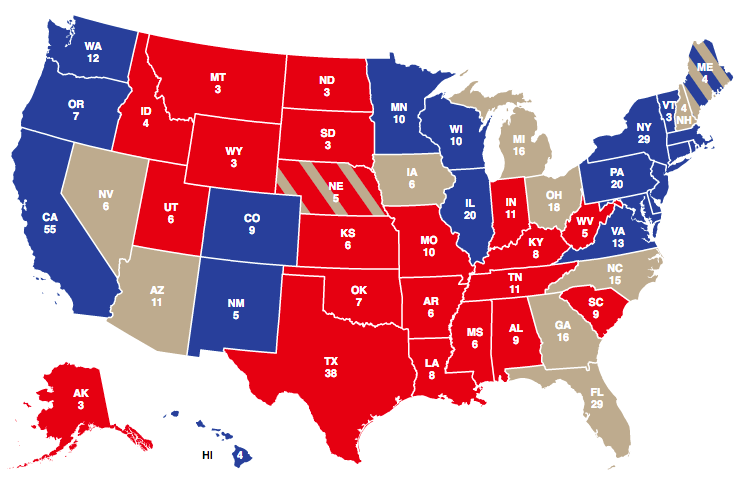
5 Election Results Maps You Need for Election Day
This post details 2016 election maps to watch on election night.
-
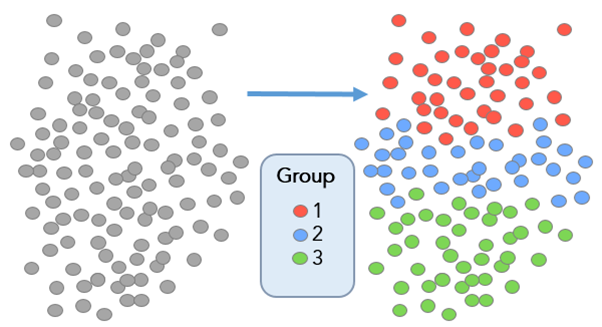
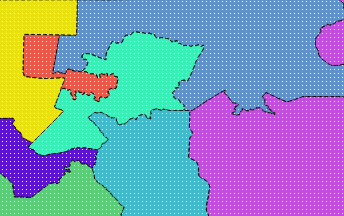
Defining Communities with ESRI’s Grouping Analysis Tool
In this post, we discuss how to define communities with ESRI’s grouping analysis tool, a powerful method aiding with data comprehension.
-
Building Interactive D3 Dashboards with CARTO Web Maps
This post details the design process we used to build a D3 dashboard, highlighting some of the key pieces of code needed to get CARTO and D3 talking to one another.
-
Creating an Interactive Visualization of Air Pollution for a Museum
This post describes our design process and the evolution of an interactive application relating to air pollution monitoring in a museum.
-
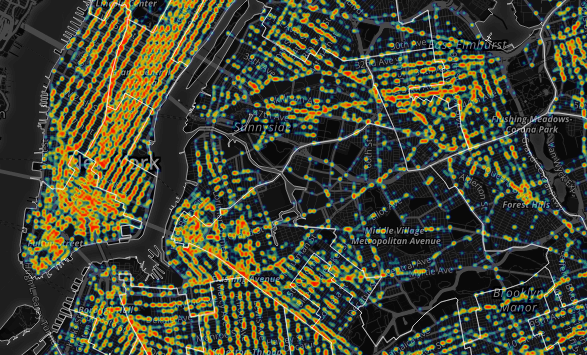
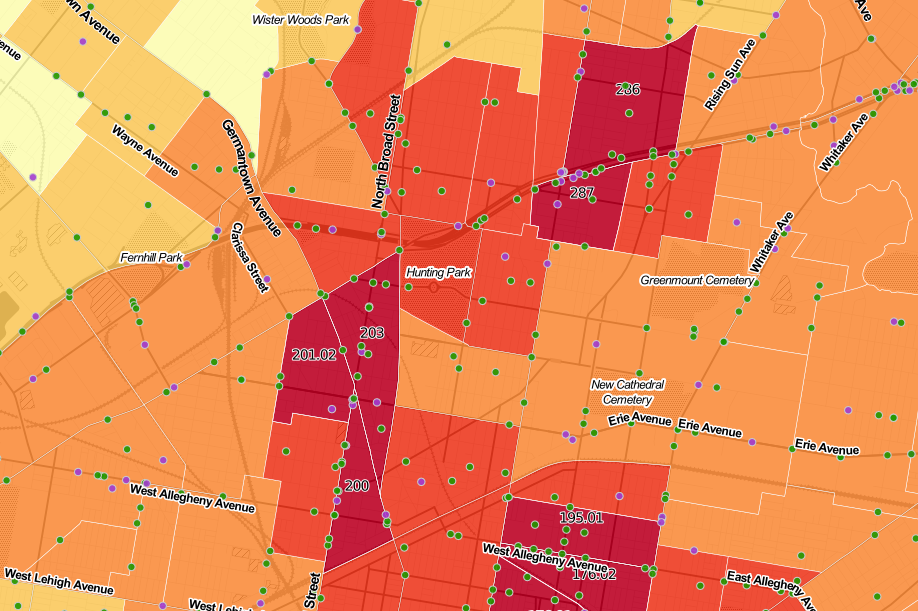
Geography of Crashes in Philadelphia
In this post, we analyze the relationship between severe road crashes, the geography of crashes, and demographics.
-
Using NAIP Imagery and a Texture Raster to Model the Urban Forest
This post walks through a method to help increase accuracy of classification by using a texture raster to distinguish between trees and other vegetation.

-
Redistricting Roundup: 2016 Edition
In this blog we give an update on all of the redistricting litigation and news we tracked during the 2016 election cycle.
-
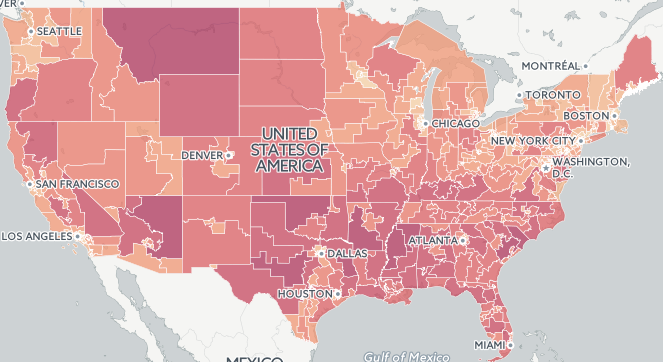
2015 Fatal Crash Data by Congressional District Released
In this post, we take a look at the geography of fatal crashes by Congressional district in the U.S in response to the recent release of the 2015 Traffic Fatalities data and call to action.
-
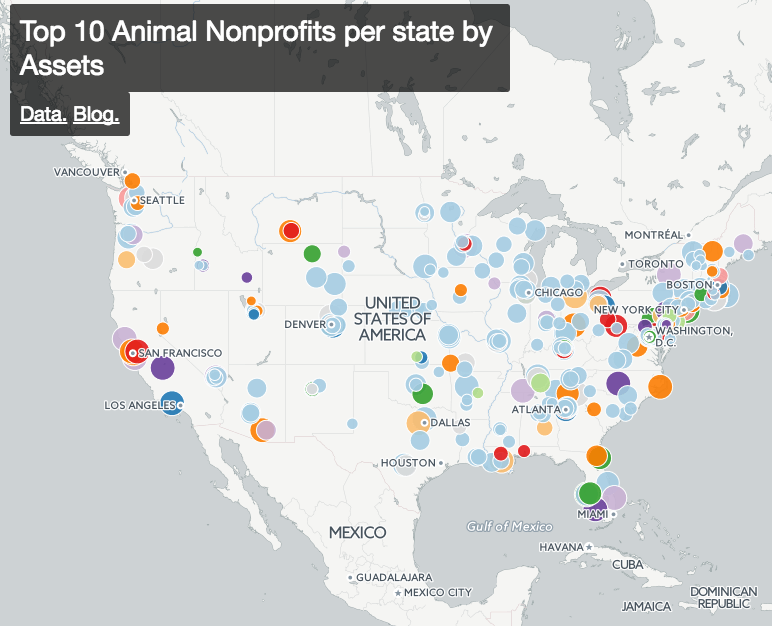
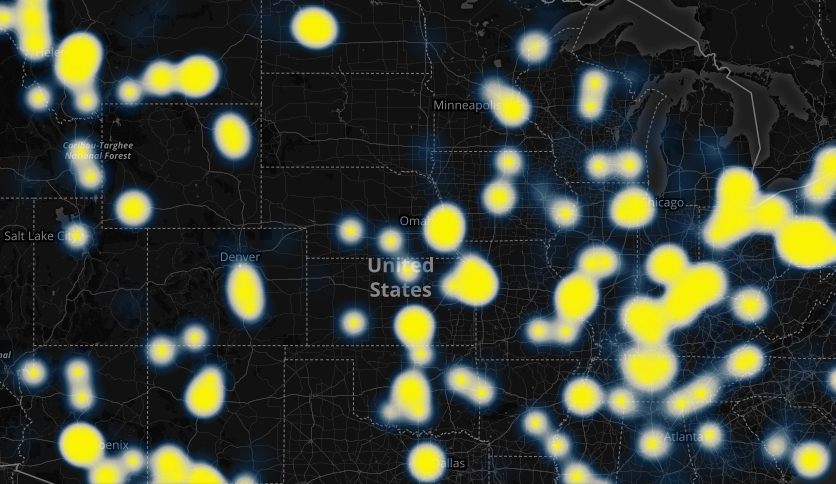
Getting Started Exploring All 1.5 Million Nonprofits in the US
In this post we discuss how to find and categorize data about all of the 1.5 million US nonprofits.