All blog posts
<- View categories
-
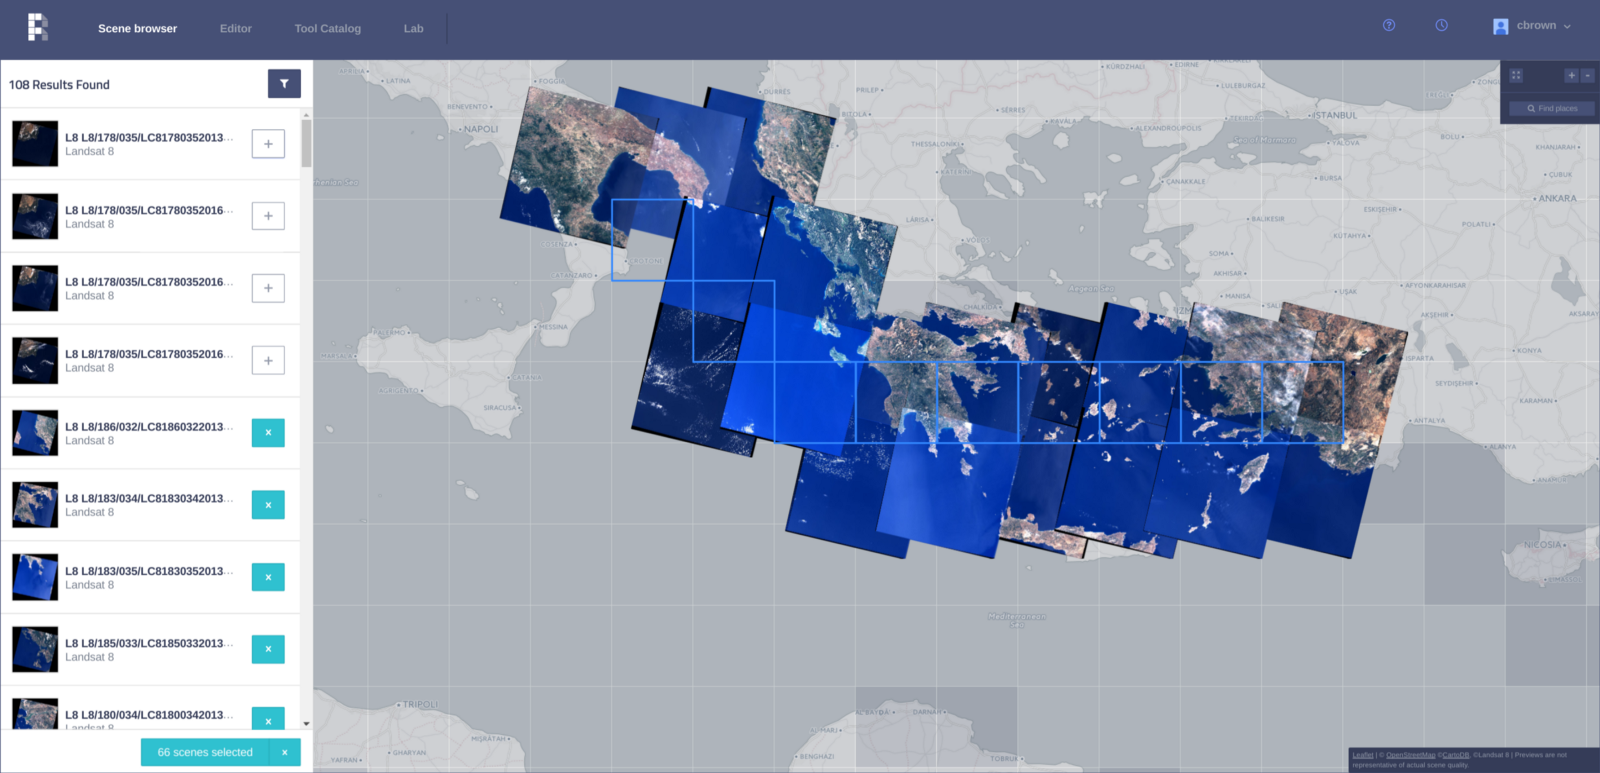
Raster Foundry: Geospatial Analysis at Any Scale
Azavea has a rich history of productizing our research: from forecasting crime to managing green infrastructure in cities to aggregating elected official data. One of the primary reasons that I love working here is our ongoing commitment to supporting research that translates directly into civic and social impact (typically by making complex analytical tools approachable…
-
Raster Foundry: Geospatial Analysis at AnyВ Scale
Azavea has a rich history of productizing our research: from forecasting crime to managing green infrastructure in cities to aggregating elected official data. One of the primary reasons that I love working here is our ongoing commitment to supporting research that translates directly into civic and social impact (typically by making complex analytical tools approachable…
-
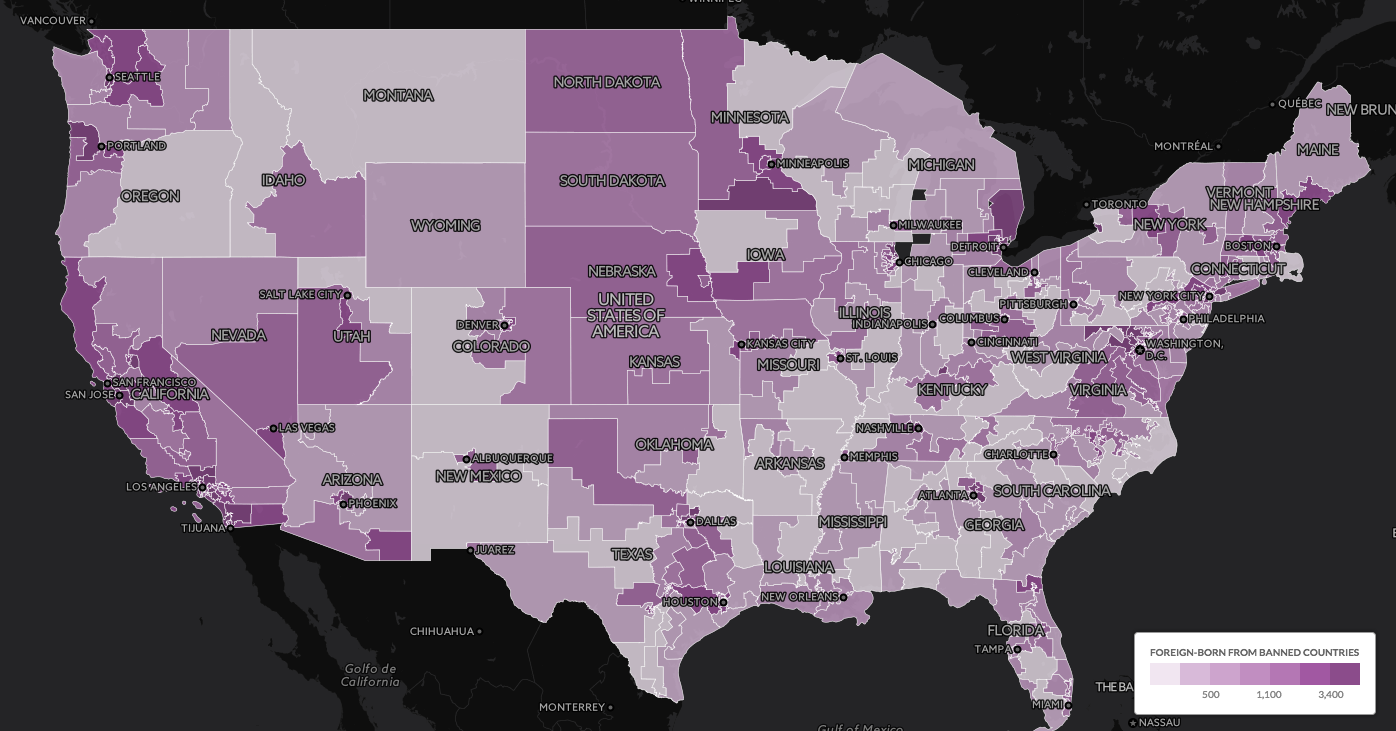
5 Questions You Can Answer with Maps and Data Visualizations
The Azavea Data Analytics Team is holding the last installment of the Map Readiness webinar series on March 22nd, 2017 from 2-3pm EST. We’llВ walk you through the analytics techniques and tools we use to help our nonprofit partners answer their biggest questions. Optimize Your Nonprofit As you may know, we at Azavea’s Data Analytics Team…
-
A World’s Worth of VectorTiles
This post outlines our general approach, our current status, and some of the roadbumps we’ve hit along the way while developing a free-and-open-source pipeline in Mapbox VectorTiles.
-
Strategies for reducing memory usage in Django migrations
This post is a collection of strategies for reducing memory usage during Django migrations.
-
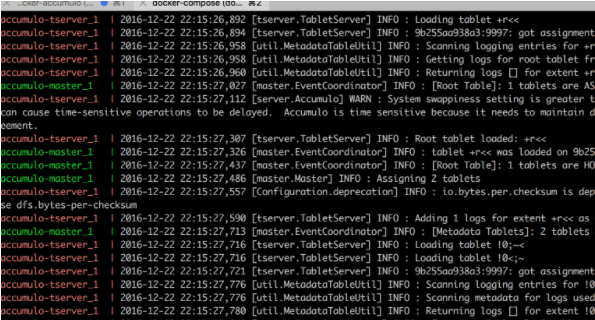
GeoDocker Development Workflow
In this post we discuss our experience using GeoDocker, a collection of Docker containers, to overcome challenges associated with developing, testing, and deploying data projects.
-
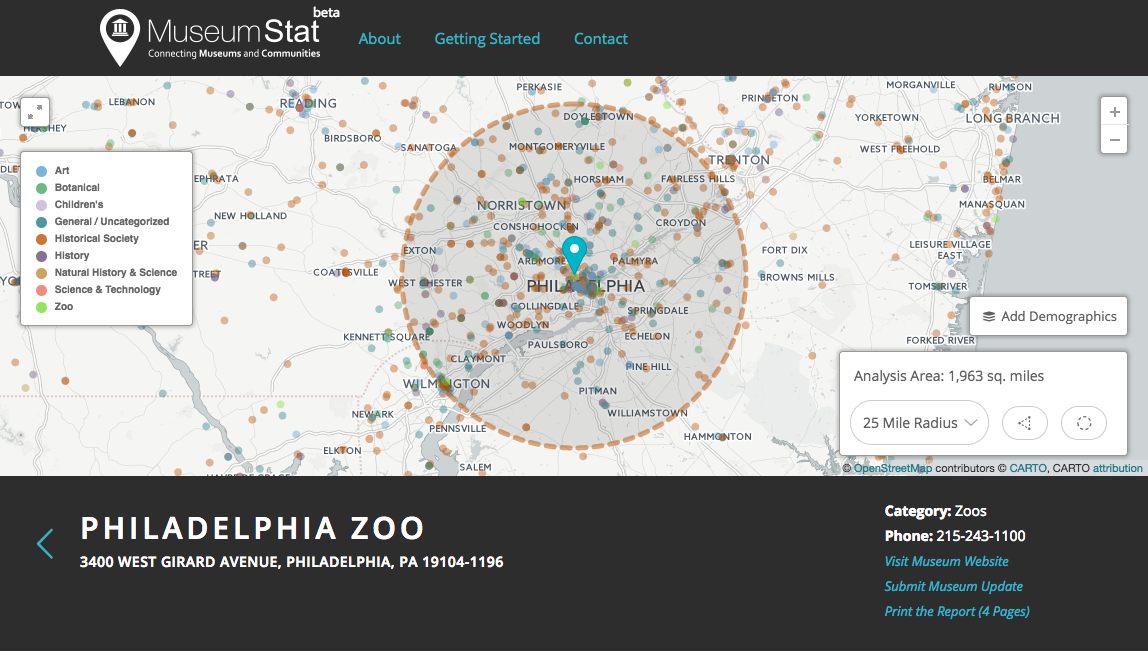
Visualize US Museums with MuseumStat
In this post, we discuss MuseumStat, an application developed by our team as a resource for museums, communities, and researchers to gain insights into the reach of museums and communities they serve.
-
GeoTrellis 1.0 Release with LocationTech
This post will explain the motivation to release GeTrellis under LocationTech and what the decision means for GeoTrellis users and contributors.
-
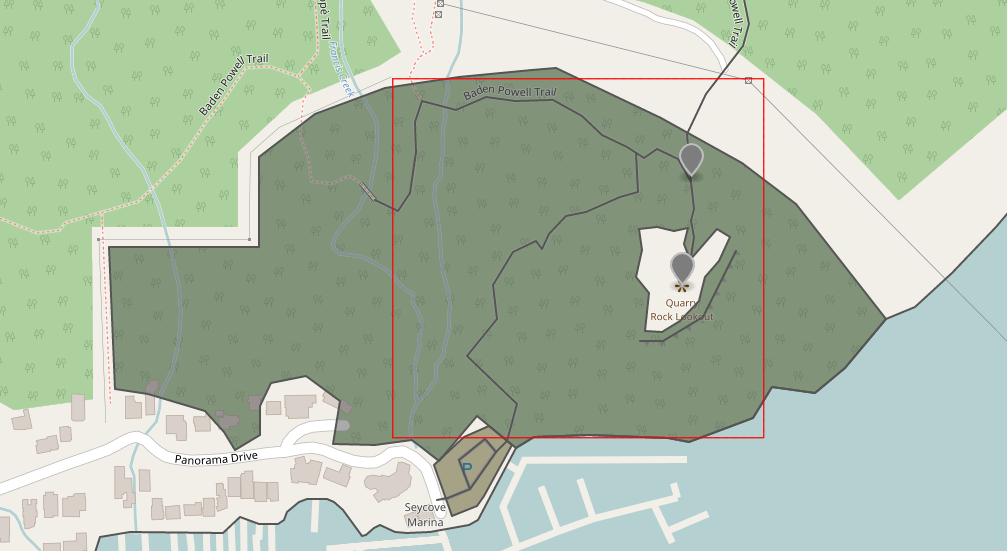
Getting Started with React and Leaflet
This blog post offers a brief tutorial for beginningВ to use React with Leaflet.

-
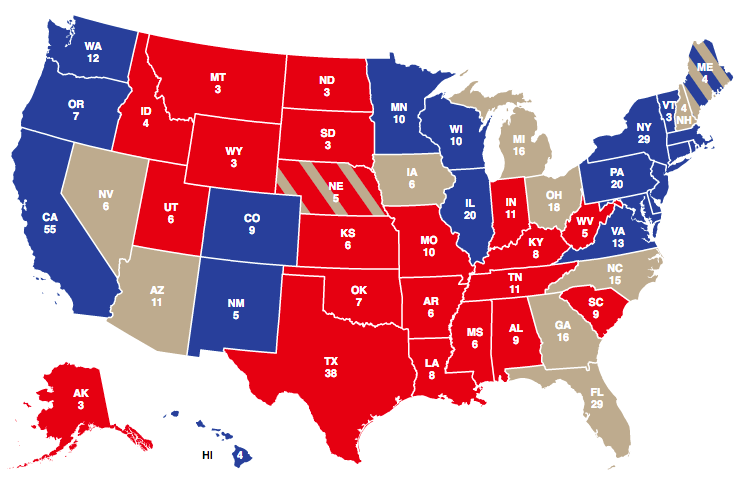
5 Election Results Maps You Need for Election Day
This post details 2016 election maps to watch on election night.
-
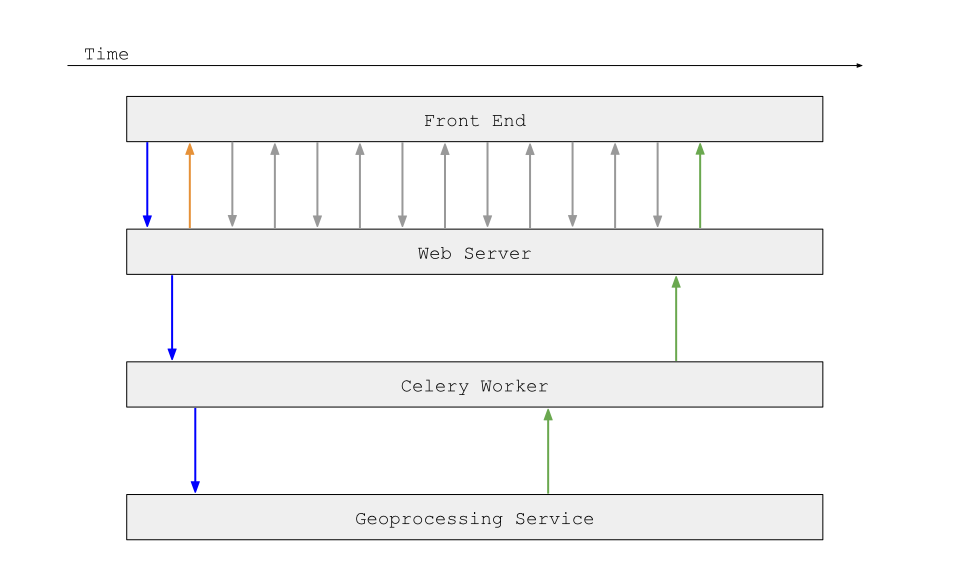
How to Build Asynchronous Workflows in a Geospatial Application
In this post, we discuss the ins and outs of making a large system asynchronous.