All blog posts
<- View categories
-
Exploring Pennsylvania’s Gerrymandered Congressional Districts
Explore Pennsylvania’s soon-to-be-defunct gerrymandered Congressional districts through info prepared for a U.S. Federal Court expert witness report.
-
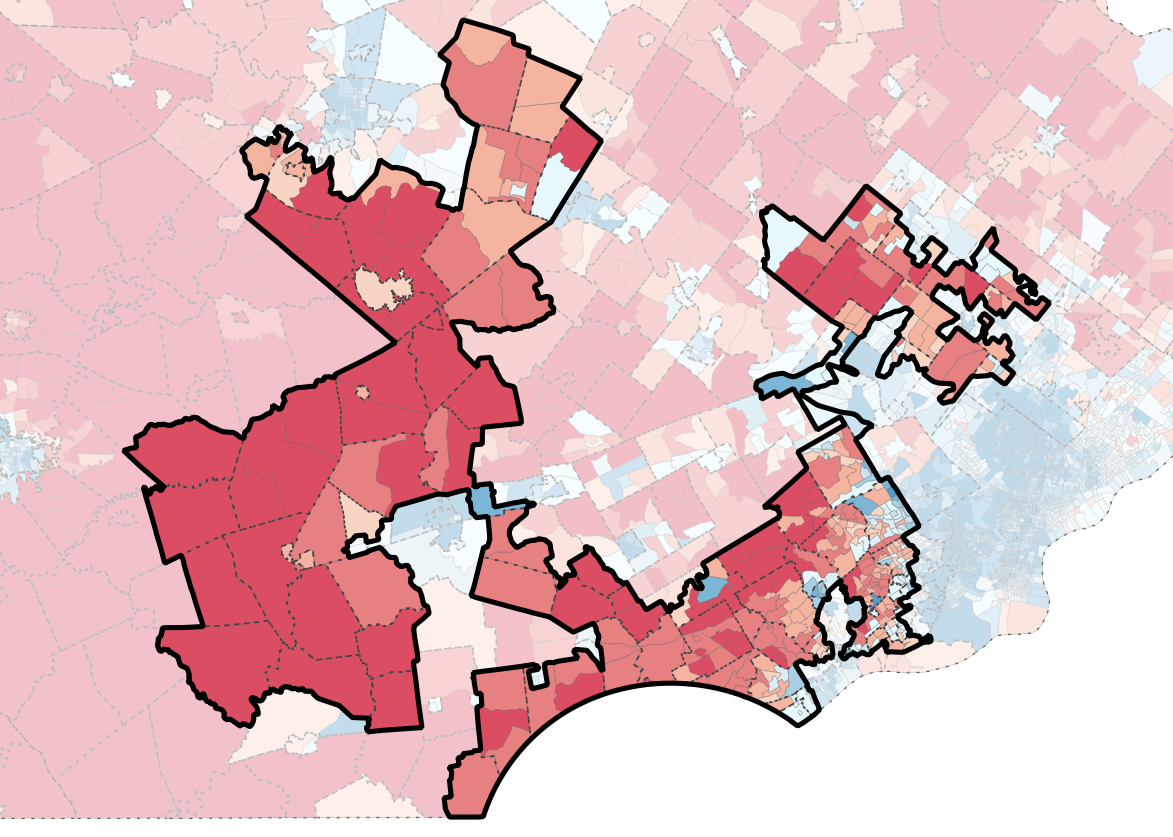
Exploring Pennsylvania’s Gerrymandered Congressional Districts
Explore Pennsylvania’s soon-to-be-defunct gerrymandered Congressional districts through info prepared for a U.S. Federal Court expert witness report.
-
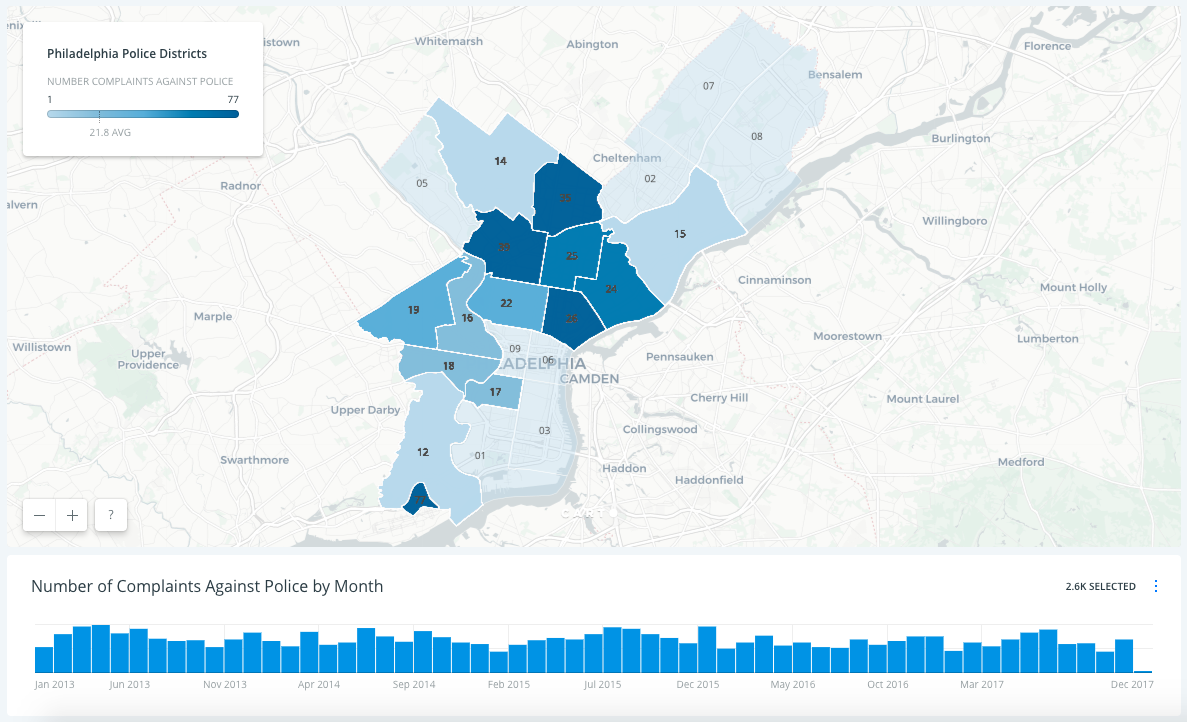
Map of Complaints Against Philadelphia Police from 2013 to 2017
This high level analysis joins newly released open data with Police Districts to create a map of Complaints Against Philadelphia Police from 2013 to 2017.
-
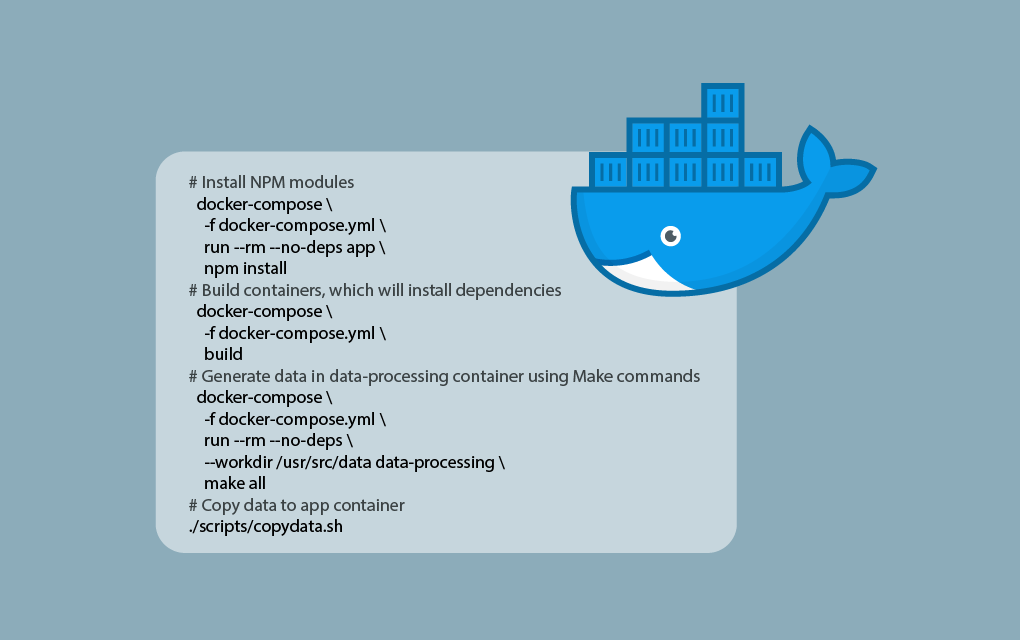
Repeatable Data Processing Workflows with Docker and Make
View the code and methods for how we used Docker and Make to create data processing workflows that match the rigor of our software development workflows.
-
Predicting Land Use in the Amazon using Deep Learning
Learn about our methods and results leveraging our RasterVision deep learning project to predict land use in satellite images of the Amazon.

-
Weighing Scalaz vs Cats Scala Libraries for GeoTrellis
After a thorough research period that compared the Scalaz and Cats libraries in depth, GeoTrellis has decided to use the Cats library. Find out why…

-
GeoTrellis 1.2 Release: New Features & Optimizations
LocationTech GeoTrellis, library that enables distributed processing of geospatial raster data, reached a new milestone in the development timeline.
-
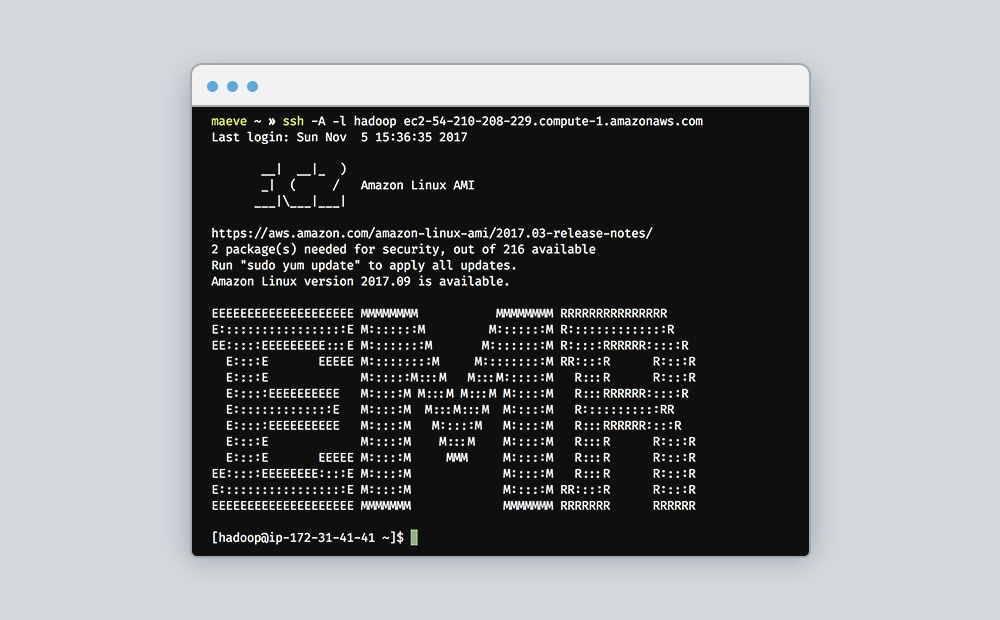
A Terraform Module for Amazon Elastic MapReduce
We encapsulated all resources required to launch an Amazon EMR cluster into a reusable Terraform module to leverage for batch GeoTrellis workflows with Apache Spark.
-
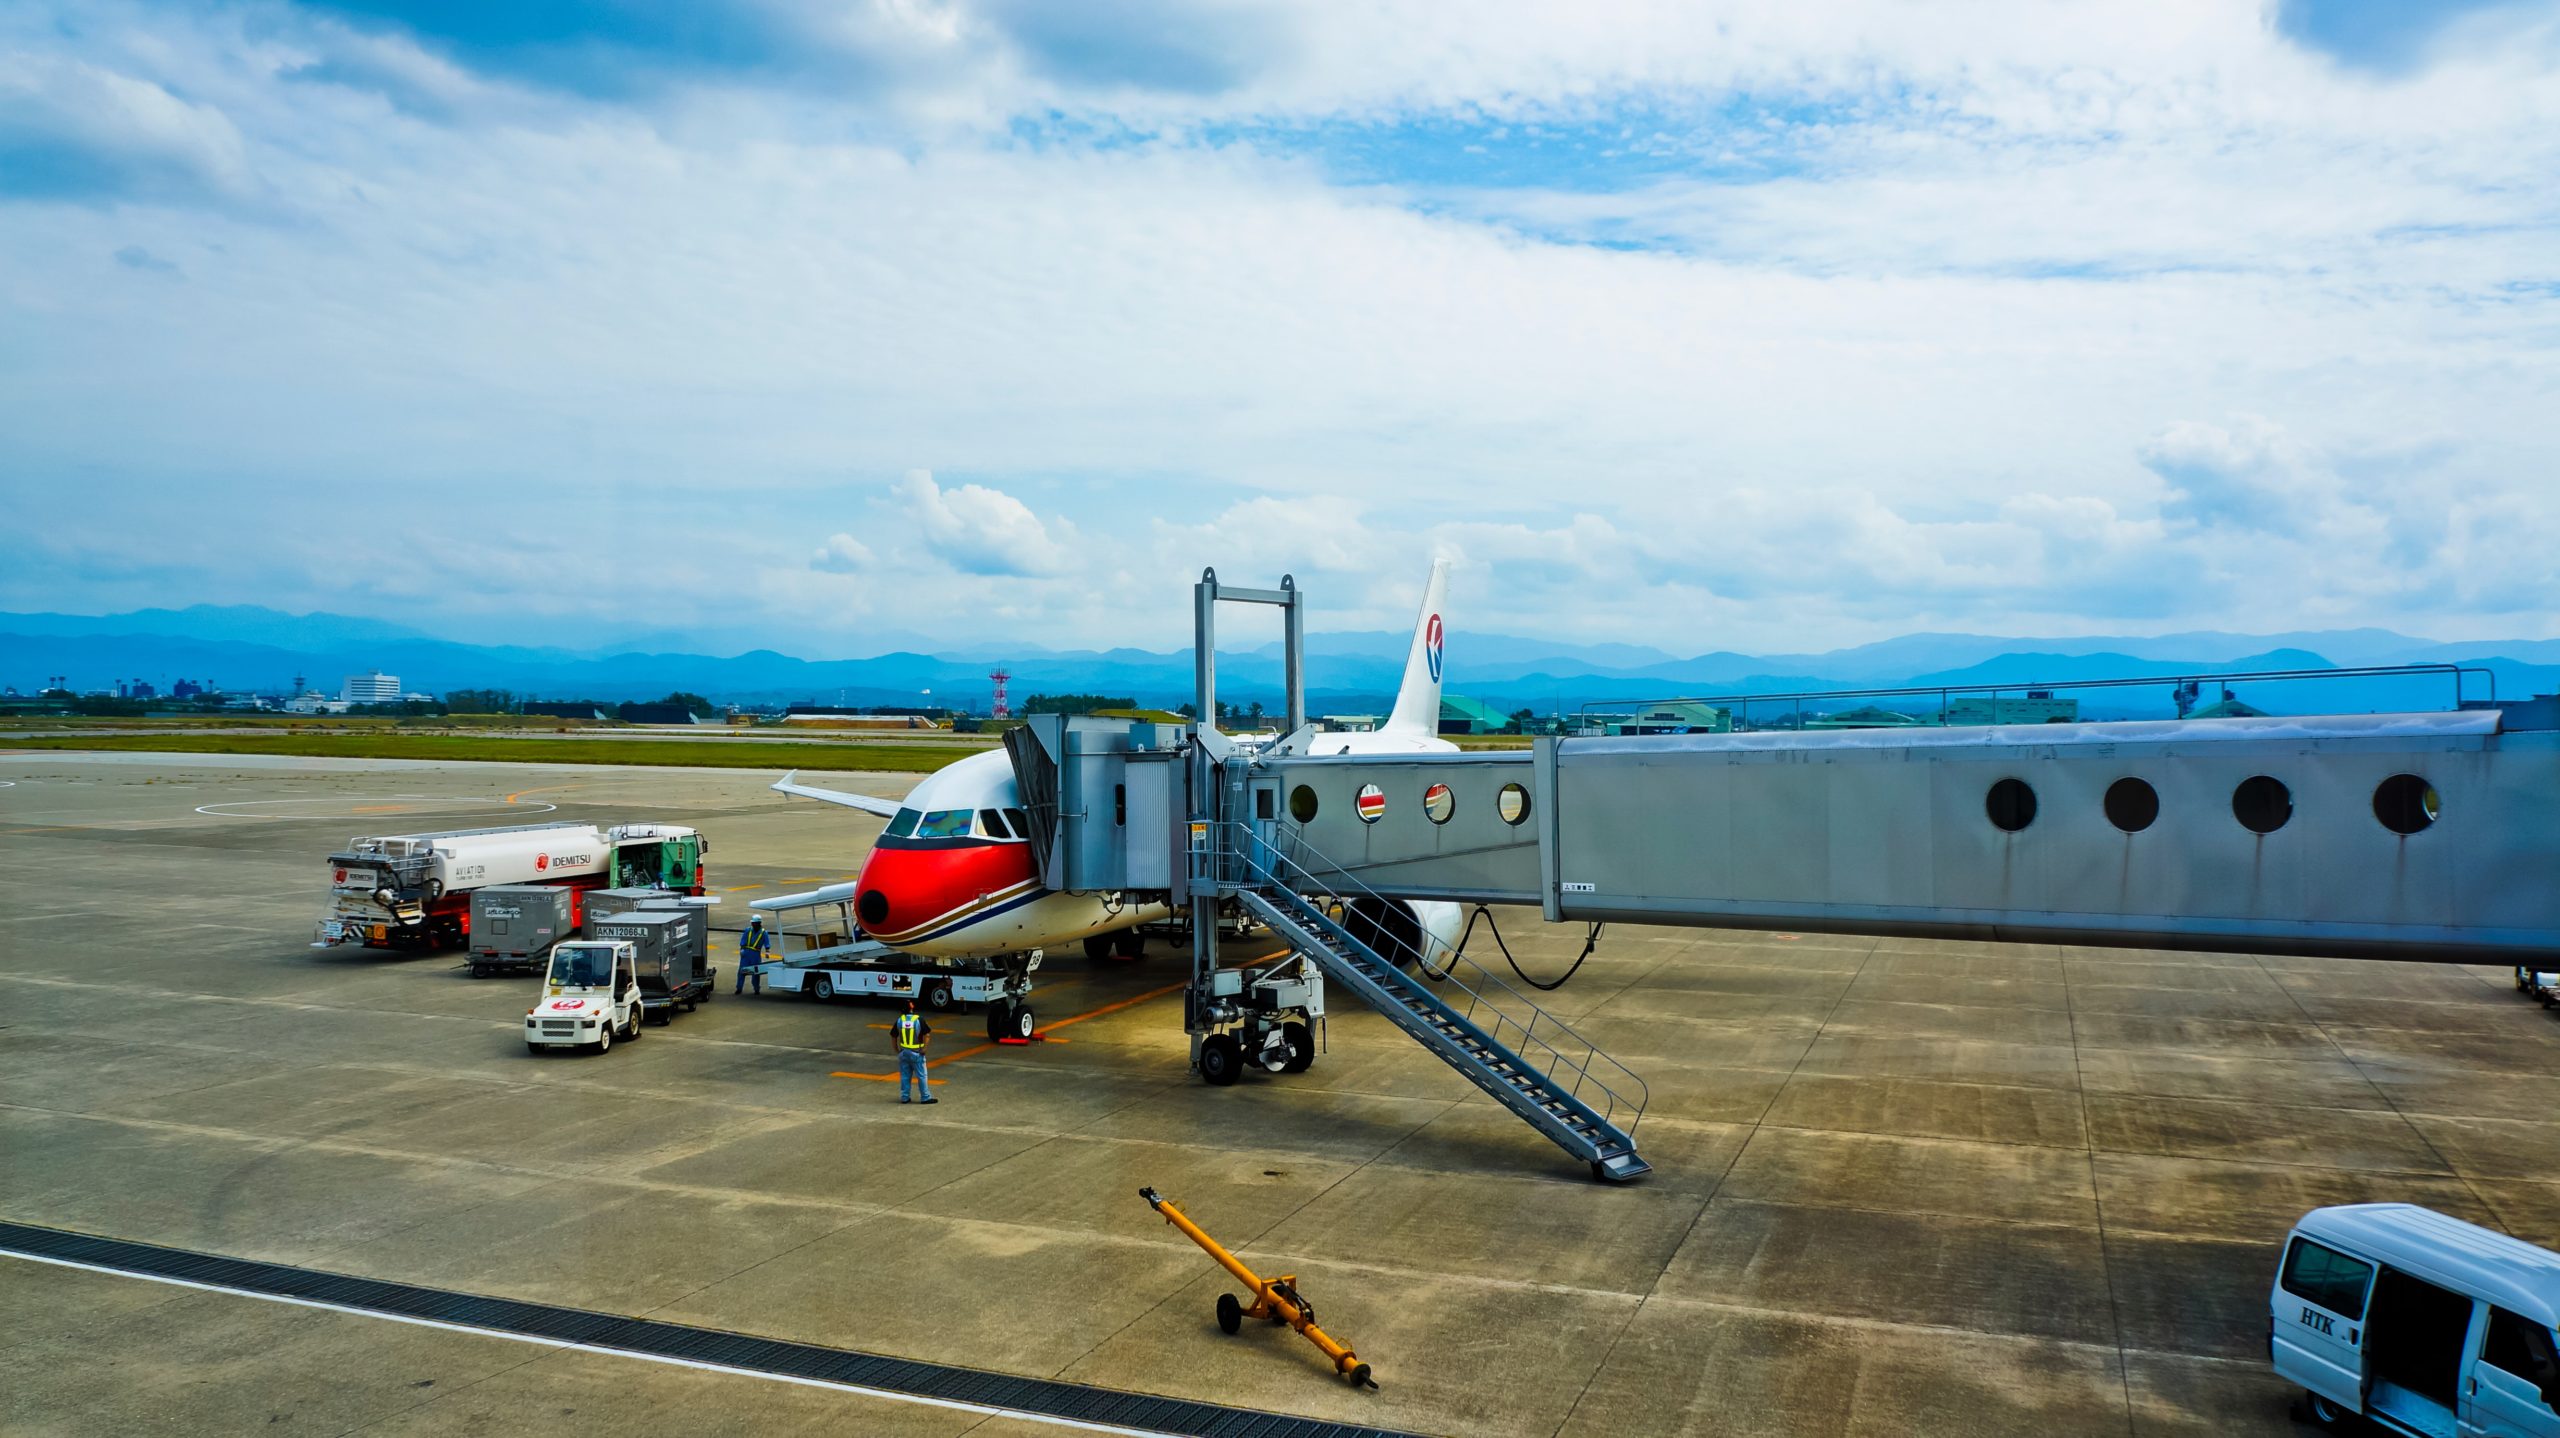
Climate Change Projections for Excessive Heat Days at Arizona Airports
We used GeoPySpark, Python binding for GeoTrellis, to analyze climate change data and determine Arizona airports at risk for excessive heat days.
-
Serving Tiles with GeoTrellis, Lambda, and API Gateway
Have this open source serverless tile server built with the Serverless framework, AWS Lambda, AWS API Gateway, and GeoTrellis up and running in minutes.

-
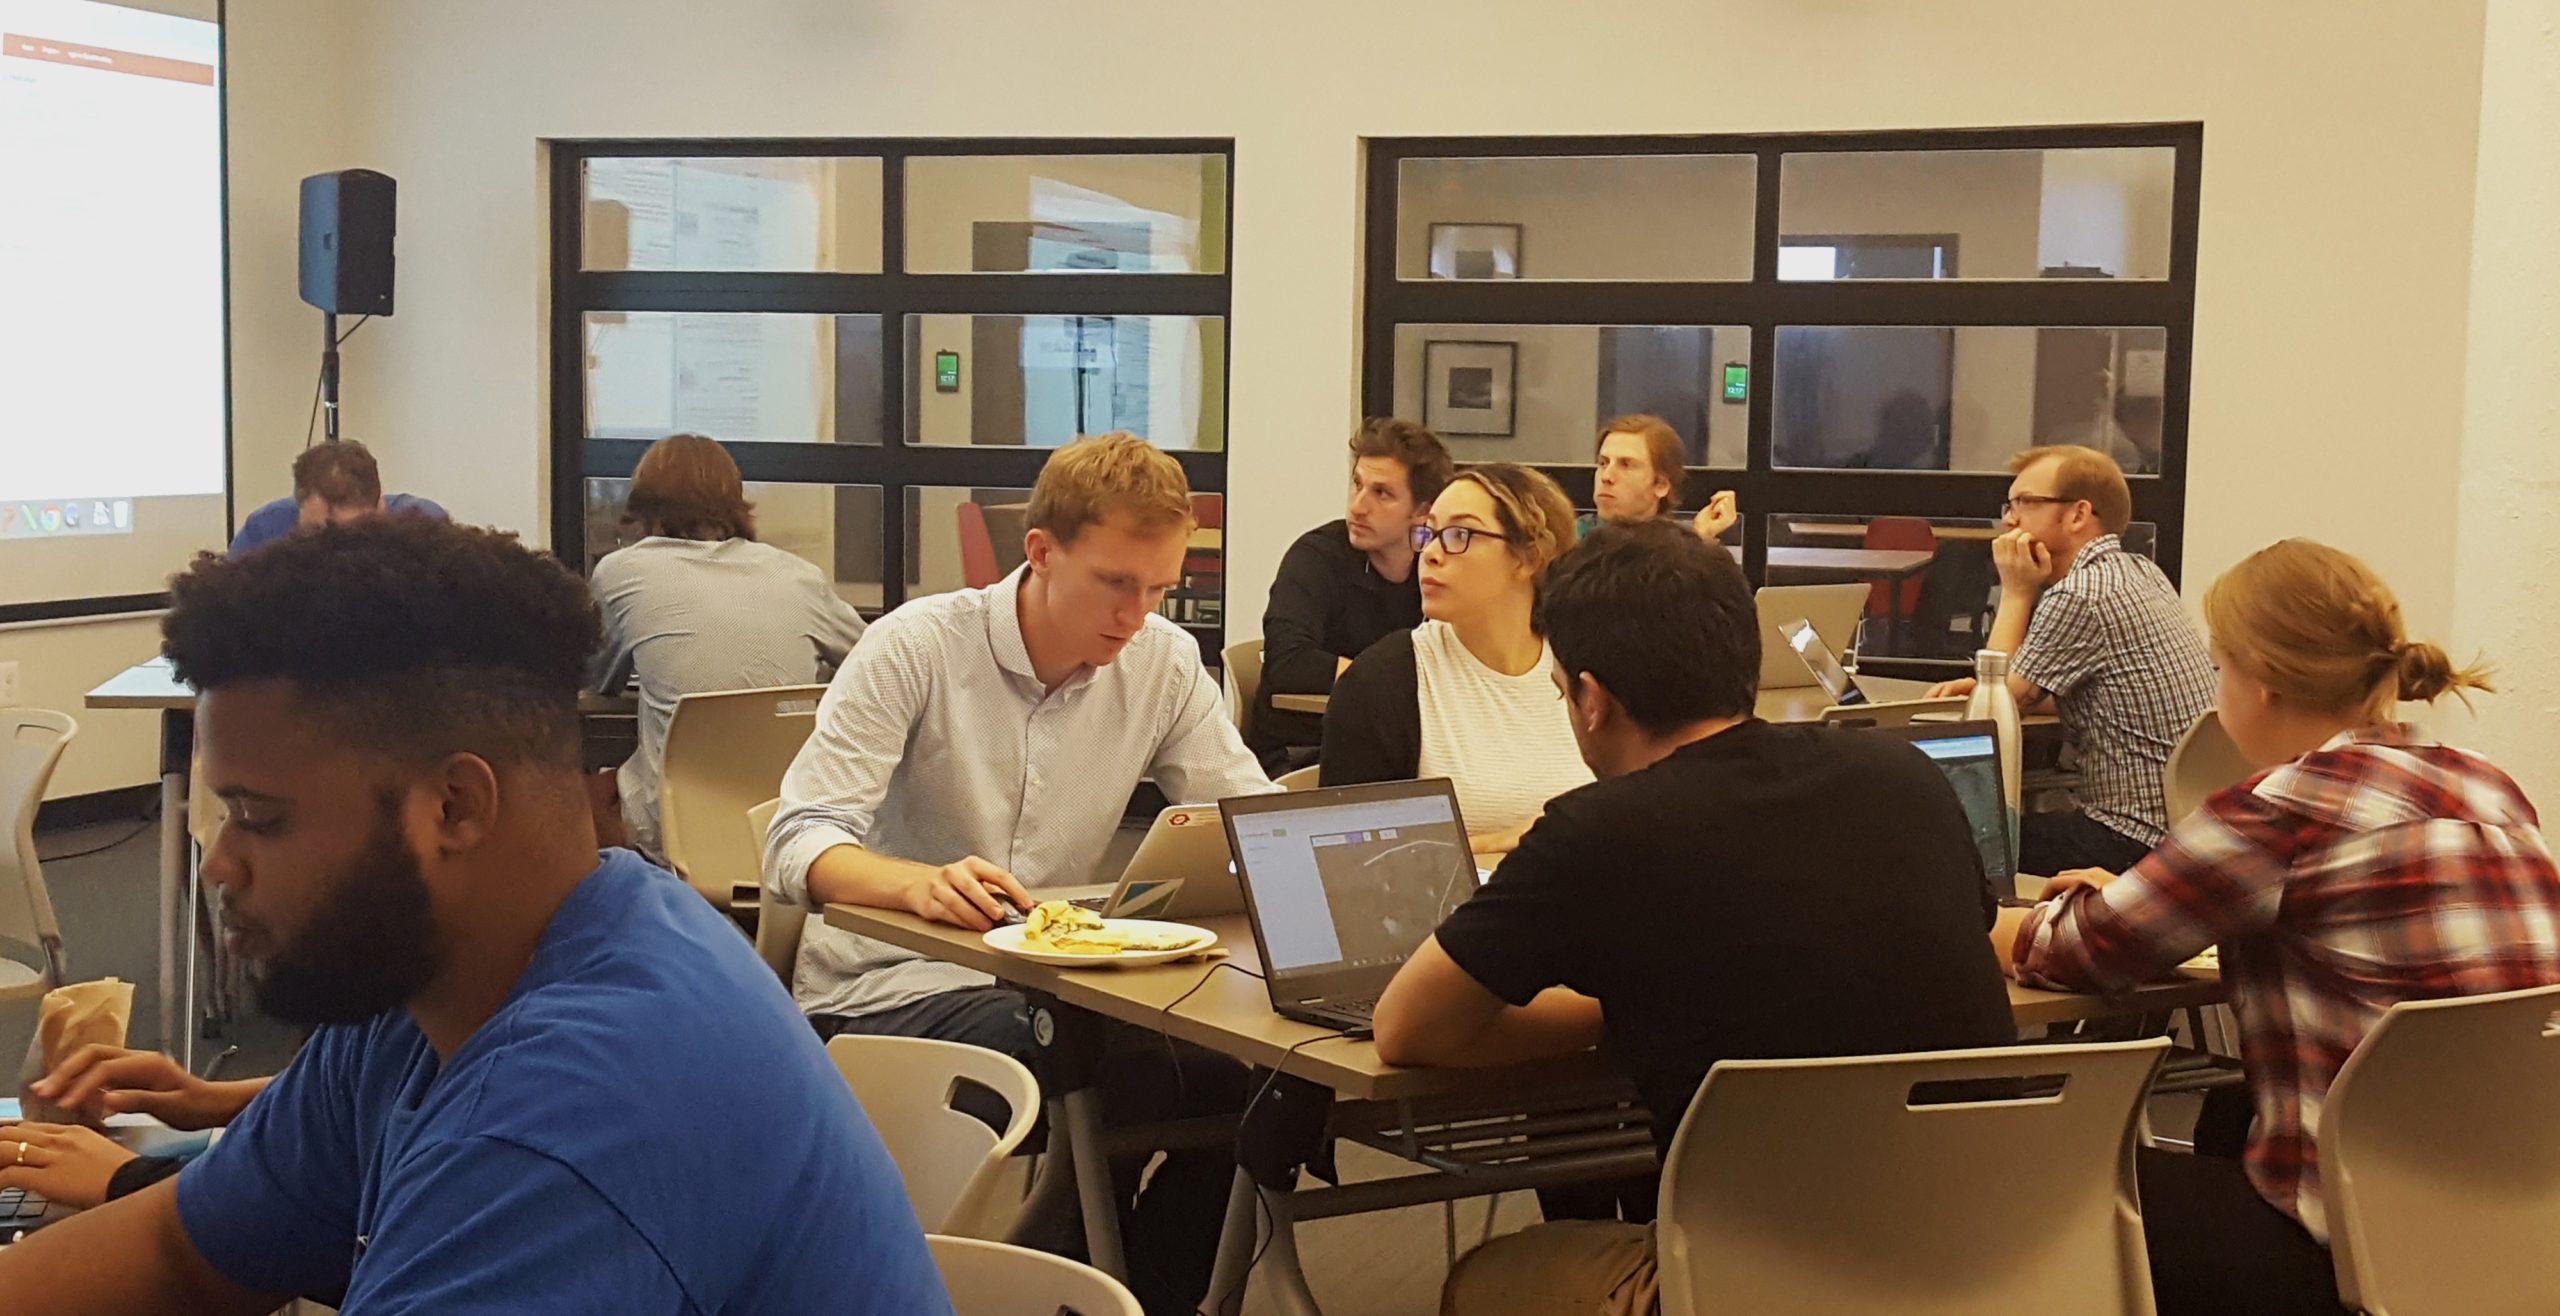
#HOTLunch: Volunteer Your Lunch Break to Support Disaster Relief Efforts
Volunteer your lunch break for #HOTLunch to map features that NGOs use to plan aid efforts in response to natural disasters and humanitarian crises.